Лёд и Снег · 2020 · Т. 60 · № 3
УДК 551.324.63
doi: 10.31857/S2076673420030052
Change of Chalaati Glacier (Georgian Caucasus) since the Little Ice Age based
on dendrochronological and Beryllium-10 data
L.G. Tielidze1-3, O.N. Solomina4,5, V. Jomelli6,7, E.A. Dolgova4, I.S. Bushueva4,
V.N. Mikhalenko4, R. Brauche6, ASTER Team6,8
1Vakhushti Bagrationi Institute of Geography, Ivane Javakhishvili Tbilisi State University, Tbilisi, Georgia; 2Antarctic Research Centre,
Victoria University of Wellington, Wellington, New Zealand; 3School of Geography, Environment and Earth Sciences, Victoria
University of Wellington, Wellington, New Zealand; 4Institute of Geography, Russian Academy of Sciences, Moscow, Russia;
5Higher School of Economic, Moscow, Russia; 6CNRS, UMR 34 Aix-Marseille University, CNRS-IRD-Coll, France;
7CNRS, LGP, Sorbonne University, Paris, France; 8A comprehensive list of consortium members is given at the end of the paper
*tielidzelevan@gmail.com
Изменения ледника Чалаати (Грузинский Кавказ) с малого ледникового периода
по данным космогенных изотопов (10Be) и дендрохронологии
© 2020 г. Л.Г. Тиелидзе1-3*, О.Н. Соломина4,5, В. Джомелли6,7, Е.А. Долгова4, И.С. Бушуева4,
В.Н. Михаленко4, Р. Брошэ6, Команда АСТЕР6,8
1Институт географии им. Вахушти Багратиони, Тбилисский государственный университет им. Иване Джавахишвили, Тбилиси,
Грузия; 2Антарктический исследовательский центр, Университет Виктории, Веллингтон, Новая Зеландия; 3Школа географии
окружающей среды и наук о Земле, Университет Виктории, Веллингтон, Новая Зеландия; 4Институт географии РАН, Москва, Россия;
5Высшая школа экономики, Москва, Россия; 6CNRS, UMR 34 Экс-Марсельский университет - CNRS-IRD-Coll, Франция;
7CNRS, LGP, Университет Сорбонны, Париж, Франция; 8Полный список членов консорциума приведён в конце статьи
*tielidzelevan@gmail.com
Received January 21, 2020 / Revised March 9, 2020 / Accepted June 7, 2020
Keywords: Cosmic Ray Exposure dating, dendrochronology, glacier variation, Greater Caucasus, Little Ice Age.
Summary
Glacier variations over the past centuries are still poorly documented on the southern slope of the Greater
Caucasus. In this paper, the change of Chalaati Glacier in the Georgian Caucasus from its maximum extent
during the Little Ice Age has been studied. For the first time in the history of glaciological studies of the Geor-
gian Caucasus, 10Be in situ Cosmic Ray Exposure (CRE) dating was applied. The age of moraines was deter-
mined by tree-ring analysis. Lichenometry was also used as a supplementary tool to determine the relative
ages of glacial landforms. In addition, the large-scale topographical maps (1887, 1960) were used along with
the satellite imagery - Corona, Landsat 5 TM, and Sentinel 2B. Repeated photographs were used to identify
the glacier extent in the late XIX and early XX centuries. 10Be CRE ages from the oldest lateral moraine of the
Chalaati Glacier suggest that the onset of the Little Ice Age occurred ~0.73±0.04 kyr ago (CE ~1250-1330),
while the dendrochronology and lichenometry measurements show that the Chalaati Glacier reached its sec-
ondary maximum extent again about CE ~1810. From that time through 2018 the glacier area decreased
from 14.9±1.5 km2 to 9.9±0.5 km2 (33.8±7.4% or ~0.16% yr-1), while its length retreated by ~2280 m. The
retreat rate was uneven: it peaked between 1940 and 1971 (~22.9 m yr-1), while the rate was slowest in 1910-
1930 (~4.0 m yr-1). The terminus elevation rose from ~1620 m to ~1980 m above sea level in ~1810-2018.
Citation: Tielidze L.G., Solomina O.N., Jomelli V., Dolgova E.A., Bushueva I.S., Mikhalenko V.N., Braucher R., ASTER Team. Change of Chalaati Glacier
(Georgian Caucasus) since the Little Ice Age based on dendrochronological and Beryllium-10 data. Led i Sneg. Ice and Snow. 2020. 60 (3): 453-470.
doi: 10.31857/S2076673420030052.
Поступила 21 января 2020 г. / После доработки 9 марта 2020 г. / Принята к печати 7 июня 2020 г.
Ключевые слова: Большой Кавказ, дендрохронология, колебания ледников, космогенные датировки, малый ледниковый период.
Для реконструкции колебаний ледника Чалаати в Грузии использовались космические снимки,
старые карты, повторные фотографии, дендрохронология, лихенометрия и анализ космогенных
изотопов. Максимальное наступание ледника в начале малого ледникового периода произошло
в ~1250-1330 гг., второй максимум, когда ледник достиг почти такой же длины, датируется при-
мерно 1810 г. С этого времени до 2018 г. площадь ледника уменьшилась с 14,9±1,5 до 9,9±0,5 км2
(33,8±7,4%, или ~0,16% год-1), а его длина сократилась на ~2280 м.
453
Палеогляциология
1. Introduction
one of the most frequently visited glaciers in Georgia
due its close location to the road, gentle valley incli
Francois E. Matthes [1] was the first scien
nation and low position of the terminus. Today this
tist to use the term Little Ice Age, which is global
valley is used for the construction of the hydropower.
ly known as one of the coldest periods of the last
Water and debris from Chalaati Glacier will be fill
millennia. The Little Ice Age is a documented cool
ing this reservoir, the rate of which is highly depends
ing event that began around the XIII or XIV centu
on the future state of Glacier, making this study es
ry and peaked between the mid-XVI and mid-XIX
pecially relevant; 4) in addition, Chalaati valley is
centuries [2]. The spatial extent of this cold condi
the best location on the southern slope of the Great
tion was mostly observed in the Northern Hemi
er Caucasus where the well-preserved Little Ice Age
sphere, although the cooling phase was also noted in
moraines are covered by old conifer forest and, which
other regions with different intensities and time peri
are useful for dendrochronological purposes. The
ods. Recent studies revealed strong spatio-temporal
goal of our paper is to: 1) reconstruct the spatial vari
variations in this cooling with synchronous or asyn
ations of Chalaati Glacier; 2) assess the age of glacier
chronous cool decades between regions suggesting a
deposits of the most recent centuries; 3) estimate the
complex pattern of change [3]. Quantifying glacier
length and area changes; and 4) compare the varia
change during the Little Ice Age is important when
tions of this glacier in the Little Ice Age with those
attempting to understand regional climatic chang
of similar type and size from northern side of the
es and can also help to improve the understanding
Greater Caucasus and other mountain regions (e.g.
of any predictions of future glacial changes. Glacier
European Alps). This will increase the knowledge of
variations themselves can be also used for the model
the more recent portion of the Holocene glaciation
ling studies [4].
from the Greater Caucasus.
Detailed records of variations spanning the past
few centuries for glaciers on the northern slope of
Greater Caucasus in the past few centuries were re
2. Study area
cently published [5-8]. These records were based
on the analyses of satellite imagery and maps, old
The Greater Caucasus is one of the world’s high
historical materials, lichenometry, tree-rings and
est mountain systems, containing over 2000 gla
14C dating. While some records of past glacier varia
ciers with a total area of about 1200 km2. The Geor
tions [9] are available for the glaciers located on the
gian side of the Greater Caucasus contains about
southern slope of Greater Caucasus [10-12], the sta
700 glaciers with a total area of about 370 km2 [11].
tus of Georgian glaciers during the Little Ice Age
These glaciers play a significant role in the ecology
period is so far more poorly documented [13] com
and economy of Georgia. They provide a freshwa
pared to their northern counterparts. For this pur
ter source that feeds rivers in the mountainous area.
pose, Chalaati Glacier was selected on the southern
This water is essential to river ecology, particularly
slope of the Greater Caucasus in order to assess its
during the summer months when rivers have lower
variations since the Little Ice Age. We use the same
flows. Georgian glaciers also have economic impor
approach as for the northern slope such as combining
tance as a major tourist attraction with thousands of
the information from the old maps and figures, aeri
visitors each year. Local economies and livelihoods
al images, historical data, lichenometry and dendro
are connected to glacial input in these ways. Glacier
chronology [7] along with 10Be in situ CRE dating.
meltwater also supplies several hydroelectric power
We selected the Chalaati Glacier (43°07′ N,
stations. Understanding how glaciers in this region
42°42′ E) for several reasons: 1) Chalaati is an ex
are changing is therefore important for these local
ample of a well-documented glacier with a wealth of
considerations [10-13].
different historical sources (e.g. maps, photographs,
Chalaati is a compound-valley glacier and con
anecdotal evidences) [13] that allow reconstruction
sists of two flows, which are fed from the slopes of
of glacier length variations over the most recent cen
over 4000 meter-high peaks: Ushba, Chatini, Kavka
turies; 2) it is a typical valley glacier of relatively sim
si, and Bzhedukhi. Among the glaciers on the south
ple shape. This type of glacier is also climate sensitive
ern slope of the Greater Caucasus, this glacier has the
and often used for climate modelling; 3) Chalaati is
lowest terminus (1980 m a.s.l. in 2018) and intrudes
454
L.G. Tielidze et al.
into the forest zone. Three icefalls on the glacier indi
times too obscure to be used to accurately identify
cate a ledge under the glacier. The height of the larg
the position of the front. For example, according to
est icefall is ~300 m and its width is ~700 m. The two
Freshfield [14] Chalaati Glacier terminated at 5200
lower icefalls are relatively small. In the vicinity of the
feet (1585 m a.s.l.), and according the Déchy (1905),
icefalls, the glacier tongue is rugged by the various
at 1628 m a.s.l. respectively, i.e. below the confluence
fractures (serracs) going in different directions. The
to the Lekhziri River, ouside the Chaalaati valley.
edges of the glacier tongue are covered with debris of
This contradict to the image of Chalaati Glacier at
a variable thickness. It is likely that these two flows
the map of 1887 and other evidences (see discussion
will split in the near future. The middle part of the
below). This very detailed map, at a scale of 1:84 000,
glacier tongue is strongly inclined and cracked.
was used later by Podozerskiy [21] in his catalog of
The lateral moraines of Chalaati Glacier are well
the Caucasus glaciers but unfortunately, he did not
preserved. At their distal sides they are covered by
provide any indication of Chalaati frontal position.
forest, their proximal sides are bare and steep. The
Detailed analysis of this map shows some defects in
bottom of the valley stabilized in the XX century,
the shape of the glacier (see Chapters 4.4 and 5.4).
and is now covered by young birch forest. Below
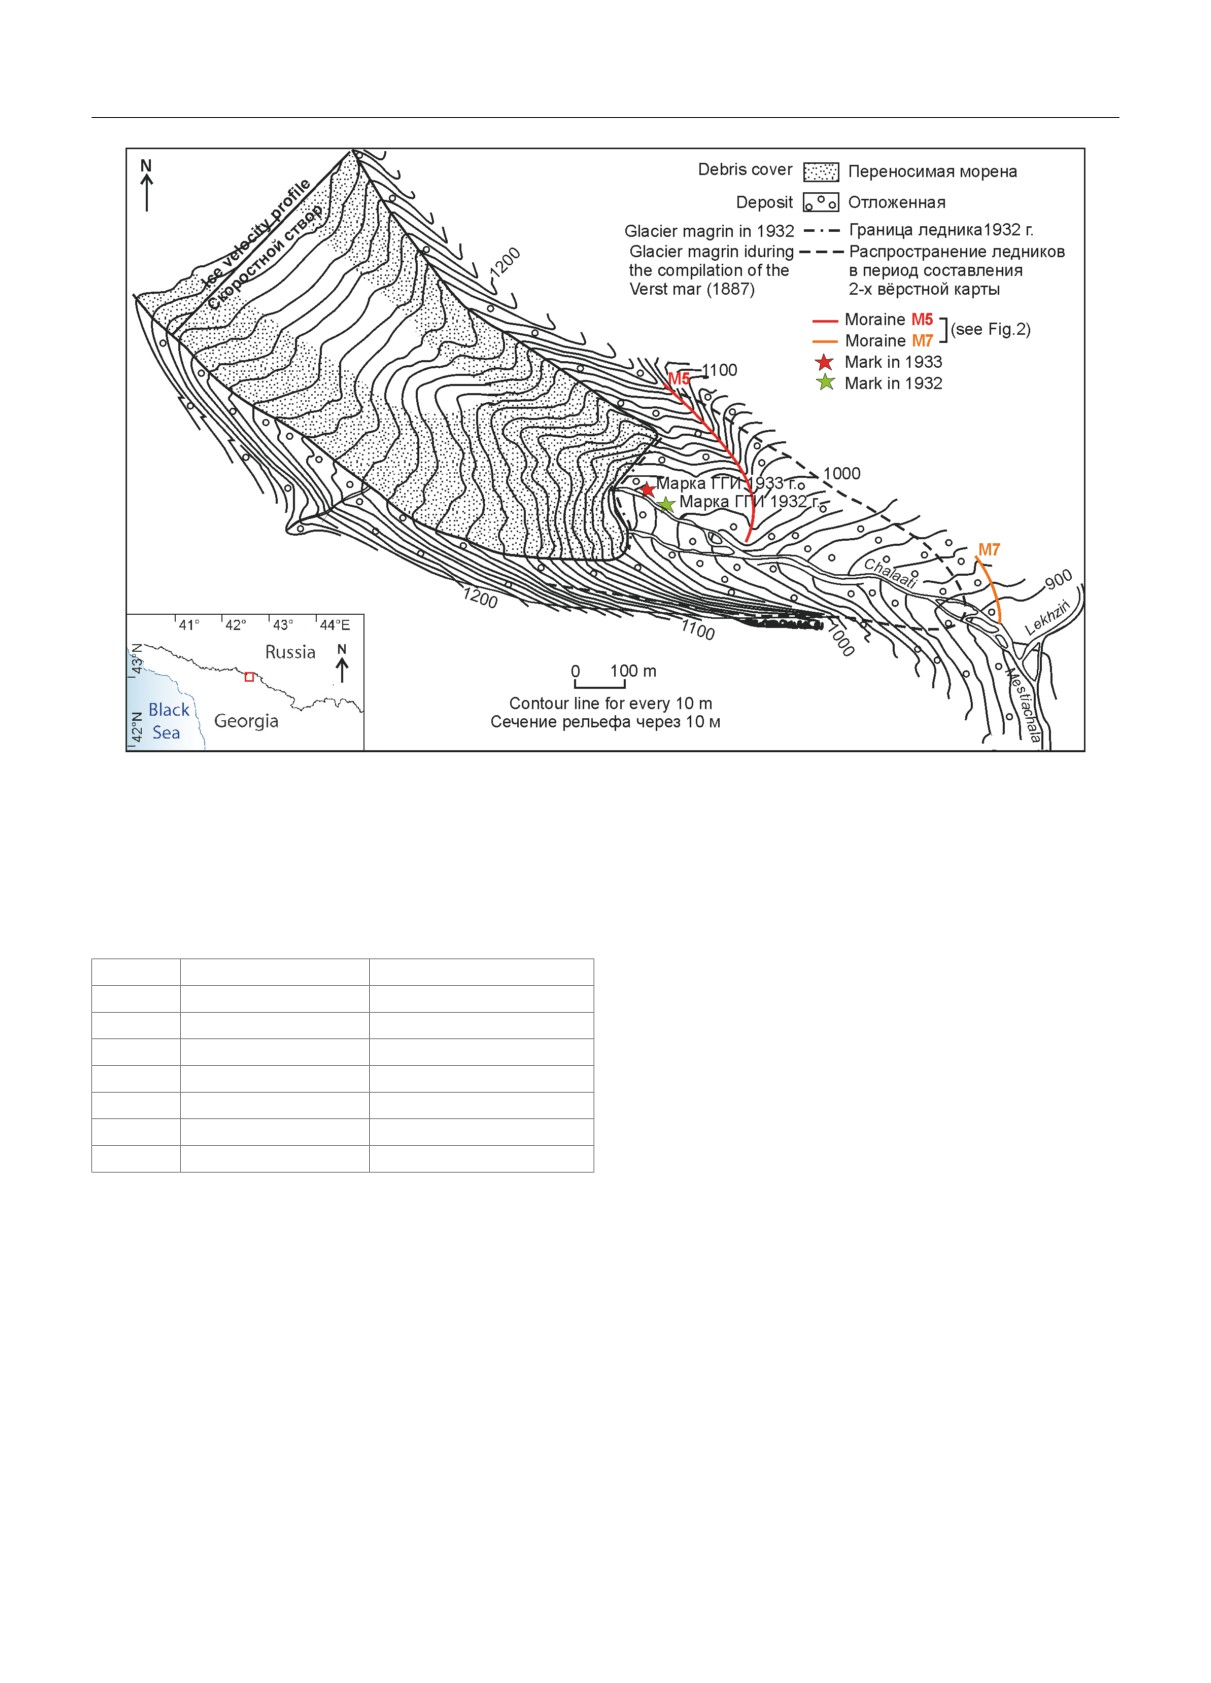
Rutkovskaya [16] studied the dynamics, ice
~1750 m a.s.l. there are older moraine walls in coni
thickness and velocity of the Chalaati Glacier during
fer forest.
the 2nd International Polar Year (Fig. 1). She found
that the glacier terminated at 1738 m a.s.l. and its
total area was 11.3 km2 in 1933. In the central part of
3. Previous studies
the glacier tongue, the ice thickness was about 50 m
and the daily ice velocity was 15.3 cm during the
A number of scholars visited and described Cha
30 days period in August 1933. According to Tserete
laati Glacier and documented the position of its front
li, [17] Chalaati Glacier retreated over 1000 m from
in the XIX and XX centuries [14-20]. Freshfield [14]
the 1890s through the 1960s [17], and in 1959 ter
was one of the first scientists to visit the glacier in
minated at 1850 m a.s.l. and the snowline was locat
1868, provided the following description: «Chalaati
ed at 3050 m a.s.l. [18]. The mass balance observa
Glacier drains a double basin on either flank of Cha-
tions at Chalaati Glacier measured in summer 1959
tini. Owing to the steepness of the general inclination
at 1980 m a.s.l. found an ablation rate of ~0.7 cm/
of its bed, it attains to a lower point in the valley than
PDD (positive degree days) in July. Between July 31
the larger stream of the Lekhziri. It reaches, indeed,
and September 1 in 1961, daily ice velocity at Chalaa
a lower point than any other ice-stream on either side
ti Glacier was 18.2 cm [19].
of the Caucasus. Not many years ago the two glaciers
R. Gobejishvili [20] was leading glacial-geomor
met at their extremity, now the Lekhziri terminates at
phological studies between 1968 and 1995. The Cha
5600 feet (1706 m a.s.l.), and the Chalaati at 5200 feet
laati Glacier terminus was surveyed by the photo-
(1585 m a.s.l.). The descent from the Chatini Pass lies
theodolite method, and large-scale map (1:2 000)
over the northern névé of the Chalaati Glacier».
was created. According to his data the glacier ter
Déchy [15] also described Chalaati Glacier a few
minated at 1880 m a.s.l. in 1980. Later these stud
years later: «Due to the steepness of its bed, the Chalaa-
ies have continued by Tielidze [13]. The ablation
ti Glacier terminates lower into the valley than a larg-
rate was measured as ~0.6 cm/PDD (positive de
er stream of the Lekhziri Glacier. In fact, at 1628 m, it
gree days) in July and ~0.4 cm/PDD in August 2011
reaches the lowest point of all the glaciers of the Greater
at 2040 m a.s.l. Glacier terminated at 1950 m a.s.l. in
Caucasus on both sides, while the Lekhziri Glacier ter-
2011 (Table 1).
minates in 1734 m. Not many years back, the tongues
of the two glaciers must have touched each other. The
rocks of the moraines, which the Chalaati Glacier
4. Data and methods
brings down from its surroundings, are gneiss granites,
syenite, with fine grains consisting of feldspar and am-
4.1. In situ 10Be cosmic ray exposure dating. Three
phibolite, and pegmatites with quartz inclusions».
samples were collected with a hammer and chisel in
Unfortunately, the measurements provided by
September 2018 from the horizontal to sub-horizon
scholars in XIX and early XX centuries are some
tal uppermost surfaces of large boulders (> 60 cm
455
Палеогляциология
Fig. 1. Chalatai Glacier terminus position in 1933 [16] (modified by authors)
Рис. 1. Конец ледника Чалаати в 1933 г. [16] (с изменениями авторов статьи)
(250-750 µm); magnetic components were eliminat
Table 1. Front position of Chalaati Glacier according to vari-
ous sources
ed using a Frantz magnetic separator. Quartz was ex
Таблица 1. Положение конца ледника Чалаати по разным tracted by dissolution of undesirable minerals in HF/
данным
HNO3 acid mixture and atmospheric 10Be removed
Years
Elevation, m a.s.l.
Reference
through sequential dissolution (~10% in mass) in di
1868
1585
Freshfield, 1896
luted HF. The obtained pure quartz was spiked with
1905
1628
Déchy, 1905
a commercial standard solution from the Scharlau
1911
Unknown
Podozerskiy, 1911
Company (1000 mg l-1 of BeO) and then digested in
1933
1738
Rutkovskaya, 1936
48% hydrofluoric acid. Beryllium was extracted using
1959
1850
Tsereteli et al., 1962
anion and cation columns and alkaline precipita
1980
1880
Gobejishvili, 1995
tion. The obtained beryllium hydroxides were dried,
2011
1950
Tielidze, 2017
and finally oxidized for one hour at 800 °C. The final
BeO oxides were combined with niobium powder
high) located on the most external moraine on the
for AMS measurements at the French 5 MV AMS
left slope of the valley. The boulders were stable and
national facility ASTER (Aix-en-Provence) [22].
without evidence of loss due to denudation process
Measurements were calibrated against the in-house
es. Sample locations and elevations were recorded
standard STD-11 with an assigned 10Be/9Be ratio
using a handheld GPS, and topographic shielding
of 1.191±0.013 × 10⁻¹¹ [23] using a 10Be half-life of
was measured using a clinometer and a compass. The
1.387±0.0012 × 10⁶ years [24]. We calculated 10Be
samples were processed at CALM lab (Cosmonu
ages using the CREP online calculator [25] and using
cléides Au Laboratoire de Meudon - France) for
the Arctic production rate [26] and the Lal/Stone
in situ CRE dating. In situ-produced 10Be was mea
time corrected scaling scheme [27, 28]. We did not
sured in the quartz mineral fraction separated from
make corrections for snow cover and denudation of
the rock samples. Samples were crushed and sieved
the boulder surface.
456
L.G. Tielidze et al.
Table 2. List of the maps and satellite images scenes used in this study
Таблица 2. Список карт и снимков со спутников, использованных в настоящем исследовании
Date
Resolution, m
Type of imagery/map
Scene ID
1887
12
1:84 000 topographic map
X_13_4
1960
5
1:50 000 topographic map
k_38_26_v
20.09.1971
2
Corona
DS1115-2154DF070_d
06.08.1986
30
LT51710301986218XXX02
Landsat 5 TM
12.08.2000
30
LT51710302000225AAA02
22.09.2018
10
Sentinel 2B
L1C_T37TGH_A008069_20180922T080212
17.11.2011
30
ASTER GDEM
ASTGTM2_N42E041
4.2. Dendrochronology. For moraine dating the
Glacier dates back to the late 19th century. The mo
standard procedures of measuring, cross-dating and
raine deposits outside this contour clearly show that
indexation routinely used in tree-ring analysis [29]
a set of advances occurred before the Chalaati Gla
were applied. We cored the trees at the moraines and
cier reached this position. The lichenometry can be
glacier forefields either at the breast height (1.5 m) or
used to roughly assess the age of these deposits [31].
at the lowest possible level near the soil surface. In the
Although this dating tool was recently criticized by
first case, in order to assess the real age of the tree, the
Osborn et al. [32], lichenometry is still in use in geo
number of rings in the core was corrected by the ad
morphic studies as an express method of a relative
dition of 15 years and samples cored near the surface
dating of landforms (for further discussion see [7]).
this correction was 5 years. When the pith in the core
Here we used this method only for the relative
was missing we used CooRecorder software which
dating and an approximate assessment of the age of
has a tool to measure «distance to pith». The number
moraines [33]. We measured the maximum diame
of missing rings was assessed using curvature of the
ters of Rhizocarpon geographicum senso lato lichens
last five rings. The trees growing on the moraines pro
at the surfaces, when there were enough large boul
vide minimum age of the surface stabilization. Over
ders at these surfaces and considered the largest (old
all, we collected twelve tree ring samples within the
est) specimen as an indicator of the age of moraines.
two days (27-28 September 2018). Three long living
This method was criticized by Naveau et al. [34] and
species (Scots pine (Pinus sylvestris L.), Nordmann fir
Jomelli et al. [33] as statistically incorrect and the
(Abies nordmanniana (Steven) Spach.), spruce (Picea
GEV approach was suggested instead as a more sta
orientalis) are growing at the Little Ice Age moraines
tistically robust. Unfortunately we do not have origi
of the Greater Caucacus glaciers and they can poten
nal data from the growth curve constructed by Sere
tially provide ages of the surfaces up to five hundred
bryanny et al. [9] for the southern slope of Greater
years old. The eccesis (time lag for colonization) for
Caucasus where single maximum diameters of li
pine used for the dating at the northern slope of the
chens for five moraines from 14-15 years old up to
Greater Caucasus is 10-20 years as estimated from
3360±90 years BP (TA-1233) in Khalde valley have
the analyses of the aerial photos and direct survey
been used for this purpose (see Discussion for further
(e.g. [30]). The colonization by fir and spruce takes a
details). For this reason, we use the model suggested
few years longer. Thus, a minimum of 20 years should
by Beschel [31] to obtain a rough age estimate.
be added to the tree ring date to assess the minimum
4.4 Maps and Satellite Imagery. Old topograph
age of the surface (moraine) stabilization.
ic map (1:84 000) from the second Caucasus topo
In Chalaati valley we used the oldest conifer trees
graphic survey (1887) was used to evaluate the Cha
growing on the moraines or between the ridges. In a
laati Glacier outline (Table 2) along with the replaced
few cases when the sampling (coring) was impossible
and co-registered topographic map (1:50 000 scale)
due to the weak rotten wood we roughly counted the
from the 1960s [11]. The projection of the 1887 map
number of annual rings that would give us a rough
is different from the modern UTM system, as it was
estimate of the minimum age of the surface.
created by plane table survey using the old Russian
4.3. Lichenometry. Like at most other glaciers in
unit of length such as the Verst (1 Verst = 1.07 km).
the Greater Caucasus, the earliest map of Chalaati
In addition, the relief of this map is distorted (in
457
Палеогляциология
cluding the glacier shapes) compared to the map
for the mapping. We also crosschecked our mapped
from the 1960s and satellite imagery (see 5.4. chapter
glacial extents with high-resolution data from Digital
for more details).
Globe and Google Earth images. Glacier areas were
Corona image, dating from 1971, was obtained
also measured from the maps and all satellite imag
ery by manual digitization. The time series of maps
usgs.gov/). We co-registered the 1887 map and Co
and satellite imagery resulted in glacier area values for
rona image using the 12 August 2000 Landsat 5 TM
each corresponding date since the 1880s (1887). The
(Thematic Mapper) image as a master [10]. Offsets
glacier boundary in the accumulation area for earlier
between the images and the Corona/archival map
glaciers than 1880s was taken from the 1986 ice divide
were within one pixel (30 m) based on an analysis of
and was kept constant over time. Based on the out
common features identifiable in each dataset. We re
lines of the different survey years, corresponding areas
projected Corona image and 1887 map to Universal
and area changes were calculated.
Transverse Mercator (UTM), zones 38-north on the
The length of glaciers was determined accord
WGS84 ellipsoid, to facilitate comparison with mod
ing to Global Land Ice Measurements from Space
ern image datasets (ArcGIS 10.2.1). Together with
Landsat imagery, these older topographic maps and
longest glacier's flow was determined manually as
Corona image enabled us to identify century-long
perpendicular to the altitude contours. Front vari
glacier change.
ation measurements were conducted by using the
Two Landsat 5 TM georeferenced images dated
glacier outlines for each date, along the ice front -
6 August 1986 and 12 August 2000, were supplied by
perpendicular to the flow. We have determined gla
the US Geological Survey’s Earth Resources Obser
cier area uncertainty with a buffer method similar to
vation and Science (EROS) Center and downloaded
Granshaw and Fountain [35], and adopted by Tielid
ze [10], Tielidze and Wheate [11]. This generated an
usgs.gov/). We used a color-composite scene for both
uncertainty of the mapped glacier area of ±5.6% for
images - bands 5 (short-wave infrared), 4 (near in
1960, ±6.3% for 1971 and 1986, and ±6.7% for 2000
frared), and 3 (red).
(buffer size ±30 m), while the uncertainty was ±5.1%
High-resolution satellite instruments such as
for 2018 (buffer size ±20 m).
Sentinel 2B, with 20 m horizontal resolution avail
Due to the different projection and distorted gla
able since March 2017, help in recognizing glacier
cier shape, the map from 1887 was co-registered and
margins. Cloud free image from 22 September 2018
digitized a second time by a different operator similar
was downloaded using the REMOTE PIXEL tool
to Tielidze [10] in order to accurately access the un
certainty of the old glacier from 1887. To determine
pan-sharpened tools in ArcGIS 10.2.1 software to
the precision of the digitizing, we used the Nor
enhance pixel size (20 m) to 10 m. Advanced Space
malised Standard Deviation (NSD - based on delin
borne Thermal Emission and Reflection Radiometer
eations by multiple digitalization divided by the mean
(ASTER) Global Digital Elevation Model (GDEM,
glacier area for all outlines). The difference between
these two manually mapped outlines was ±10.3%.
asp) was used to assess the Chalaati Valley longitudi
For glacier outlines earlier than 1880s and outlines
nal profile. Other datasets used in this study include
for 1910-1940s we used a buffer size of ±60 m that
the GPS measurements (terminus position) from a
generated an average area uncertainty of ±9.7% for
2018 field survey.
1810, ±10.2% for 1840, ±10.2% for 1910, ±10.4% for
4.5. Glacier mapping and uncertainty assessment.
1930 and 1940.
The Little Ice Age glacial extent was digitized manu
ally, proceeding from the 1986 glacial extent, based
on clear visible morphological evidence, e.g. terminal
5. Results and Discussion
and lateral moraine systems. To avoid an overestima
tion of the Little Ice Age extent, larger rock outcrops
5.1. 10Be CRE ages. We collected all samples at
(as included in the scenes from 1986) were preserved.
the left side of the Chalaati valley while the right side
Due to its higher resolution compared to Landsat 5
was not accessible with no bridge over the river. We
(30 m), data from Sentinel-2 (10 m) were also used
report individual in situ 10Be CRE ages with their as
458
L.G. Tielidze et al.
Table 3. Sample details. Cosmogenic nuclide concentrations and calculated cosmic ray exposure ages from the valleys. 10Be/9Be
ratios were corrected for a process blank value of 9.11 × 10⁻¹⁵ (10Be/9Be uncertainty: 8%) (samples Geo 1,3) and 5.31 × 10⁻¹⁵
(10Be/9Be uncertainty: 15%) (sample Geo 2)
Таблица 3. Сведения об образцах. Концентрация космогенных нуклидов и рассчитанное время воздействия космиче-
ских лучей. Соотношения 10Be/9Be были скорректированы для начальных точек процесса: 9,11 × 10⁻¹⁵ (ошибка опре-
деления соотношения 10Be/9Be - 8%) (образцы Geo 1 и Geo 3) и 5,31 × 10⁻¹⁵ (ошибка определения соотношения
10Be/9Be - 15%) (образец Geo 2)
10Be
10Be
Erosion
Sample
Latitude
Longitude
Elevation,
Shielding
Density,
Thickness,
Age,
1σ,
1σ without
conc,
uncert,
rate,
ID
N
W
m a.s.l.
factor
g cm-3
cm
kyr
kyr
PR error
at g-1
at, g-1
mm yr-1
Geo 1
43.114097
42.737215
1843
10848
1657
0.9801
2.75
3
0
0.67
0.1
0.1
Geo 2
43.113806
42.738317
1820
59942
9913
0.9612
2.75
3
0
4.2
0.65
0.65
Geo 3
43.113630
42.738794
1812
12429
1284
0.9801
2.75
3
0
0.79
0.08
0.08
sociated uncertainties that include the standard devi
0.67±0.1 kyr to 4.2±0.65 kyr. Geo 2 dated at 4.2 kyr
ations of both analytical (reported Table 3) and pro
was rejected and considered as an outlier (possibly
duction rate uncertainties.
due to inheritance) compared to the other samples
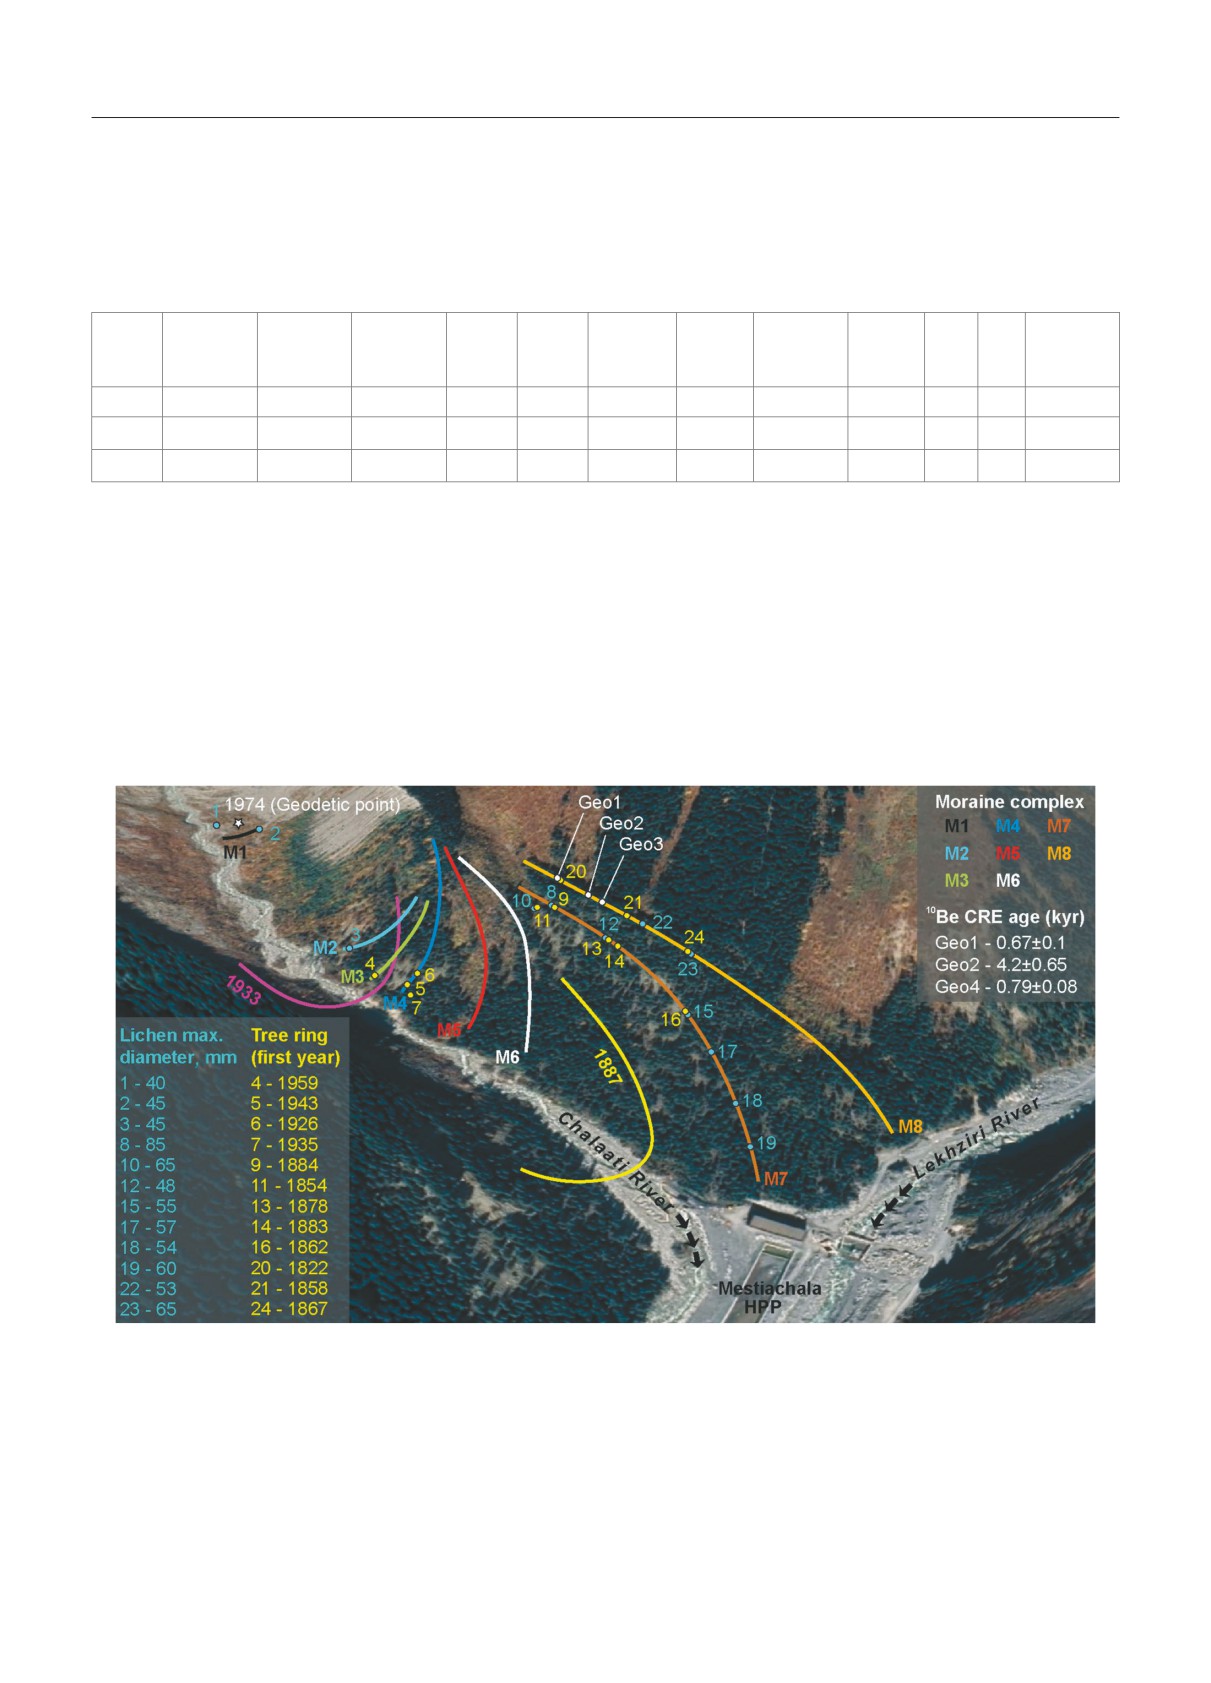
The three rock samples (Geo1-3) were col
and rejected from the analysis. Geo 1 and 3 yield a
lected on the external moraine ridge M8 to docu
mean 10Be age of 0.73±0.04 kyr and suggest a forma
ment the maximum extent of Chalaati Glacier dur
tion of moraine M8 at the onset of the Little Ice Age.
ing the last millennia in this upper part of the valley
Because of the very limited number of samples it is
(Fig. 2). These samples show ages that range from
still difficult to assess the age of this moraine. Here
Fig. 2. Moraine ridges located on the left slope of the Chalaati valley; Locations of lichen measurements (diameter in
mm) and dendrochronological sampling along with the in situ 10Be CRE ages (kyr). Sizes of lichens and ages of trees
by dendrochronology are given in Table 4. Google Earth image (21.10.2019) is used background
Рис. 2. Моренные гряды, расположенные на левом борту долины Чалаати; местоположения измеренных ли
шайников (диаметр в мм) и дендрохронологических образцов, а также возраст обломков по космогенным
нуклидам 10Be (тыс. лет). Размеры лишайников и возраст деревьев приведены в табл. 4. Изображение Google
Earth (21.10.2019 г.) использовано в качестве фона
459
Палеогляциология
Table 4. Minimum moraine age of the Chalaati Glacier based on dendrochronological measurement and maximum lichen
diameters at the moraines
Таблица 4. Минимальный возраст морен ледника Чалаати по дендрохронологическим данным и размер максималь-
ных лишайников на моренах
Name
Dendrochronological measurement
Eleva
Mo
(Number)
Latitude
Longitude
Lichens
the year of
last
presence
correction
tion,
raine
on the map
N
E
(maximum diameter, mm)
the first mea
ring,
of the
(year) for the
m a.s.l.
(see Fig. 2)
sured ring
year
core
missing pith
1
43.11533
42.72925
1829
40, 40, 40, 35, 30
М1
45, 45, 40, 40, 39, 39, 36, 35, 34,
2
43.11516
42.87320
1822
-
33, 32, 32, 31, 31
М2
3
43.11230
42.73430
1760
45, 40, 38, 35, 35
М3
4
43.11213
42.77353
1783
1965
2018
+
6
5
43.11209
42.73576
1752
1944
2018
+
1
-
М4
6
43.11209
42.73576
1752
1928
2018
+
2
7
43.11176
42.73611
1739
1939
2018
+
4
8-9
43.11355
42.73796
1812
85
1885
2018
+
1
10-11
43.11357
42.73771
1820
65, 60, 55 50, 47
1857
2018
+
3
12-13
43.11336
42.73876
1820
48
1879
2018
+
1
14
43.11338
42.73906
1792
-
1887
2018
+
4
55, 52, 50, 50, 49, 45, 42, 40, 40,
М7
15-16
43.11247
42.74066
1737
1865
2018
+
3
40, 39, 36, 35, 32, 32, 31, 22
17
43.11180
42.74117
1717
57, 52, 51, 50, 50, 42
54, 52, 51, 50, 50, 47, 46, 46, 45,
18
43.11112
42.74171
1700
-
45, 45, 43, 42, 41, 41, 40, 34, 35, 32
19
43.11012
42.74222
1670
60, 48, 45
20
43.06830
42.44266
1838
1825
2018
+
3
-
21
43.11346
42.73917
1800
1859
2018
+
1
М8
22
43.11332
42.73957
1790
53, 52, 50
-
23-24
43.11316
42.74040
1698
65, 62, 62, 62, 60
1868
2018
+
1
the mean 10Be age of 0.73±0.04 kyr has to be consid
2. The three moraine ridges - M2-M4 are locat
ered as a very preliminary estimate.
ed at an approximately 1730 m a.s.l., i.e. where the
5.2. Dendrochronological measurements. Fig. 2
termination of the glacier was recorded in 1933 by
shows the locations of dendrochronological sam
Rutkovskaya [16] (see Fig. 1).
pling sites and their position relative to moraine ridg
3. At an altitude of about 1710 m a.s.l., anoth
es. Minimum ages of moraines based on tree-ring
er, relatively older stage M5 is distinguished, which
data are presented in Table 4. The highest lateral mo
is also visible on the map of Rutkovskaya as a ridge
raines are clearly expressed in the Chalaati valley -
going down to the river. Between the two moraine
unsodded in its proximal part and covered with for
complexes M4 and M5, the distance is approximately
est - in the distal one. Their corresponding terminal
20 m vertically and 100 m horizontally.
moraine complex is more poorly preserved, but nev
4. The lower moraine ridge M6 is covered by forest
ertheless it is discernible on both sides of the valley.
and not very well shaped, especially in its lower part.
At the Fig. 2 we mapped the moraine ridges from the
5. Two older lateral moraines in this complex M7
M1 to M8 (from the youngest to the oldest) marking
and M8 stretching parallel to the slope of the valley.
individual stages of the advances or stationary stages
They are partially destroyed by debris flows and ava
of the glacier.
lanches coming from the left side of the valley. The
1. Moraine M1 at an altitude of about 1820 m a.s.l.
slope processes keep renewing the surface of these mo
marks a location of the glacier position in 1960s (In
raines, erode them and damage the vegetation growing
strumental measurement by Gobejishvili [20]).
on their surface. These tracks are clearly marked at the
460
L.G. Tielidze et al.
Google Earth image (see Fig. 2) by the lighter color of
vegetation in the lower parts of these debris-flows.
So, the best undisturbed portion of moraines
older than CE 1887 that we studied using bioindi
cation approaches is located between the two de
bris flows at the left side of the valley. The map of
1887 shows that the space left unoccupied by the ice
at that time was quite narrow. One moraine ridge
descending to the Lekhziri River is marked on this
map. In fact, there are at least two moraine ridges
outside the glacier limits indicated on the 1887 map,
which was not accurate enough to determine if it cor
responds to M7 or M8.
The first tree-ring sample that we got from the
moraine 3 that is located very close to the margins
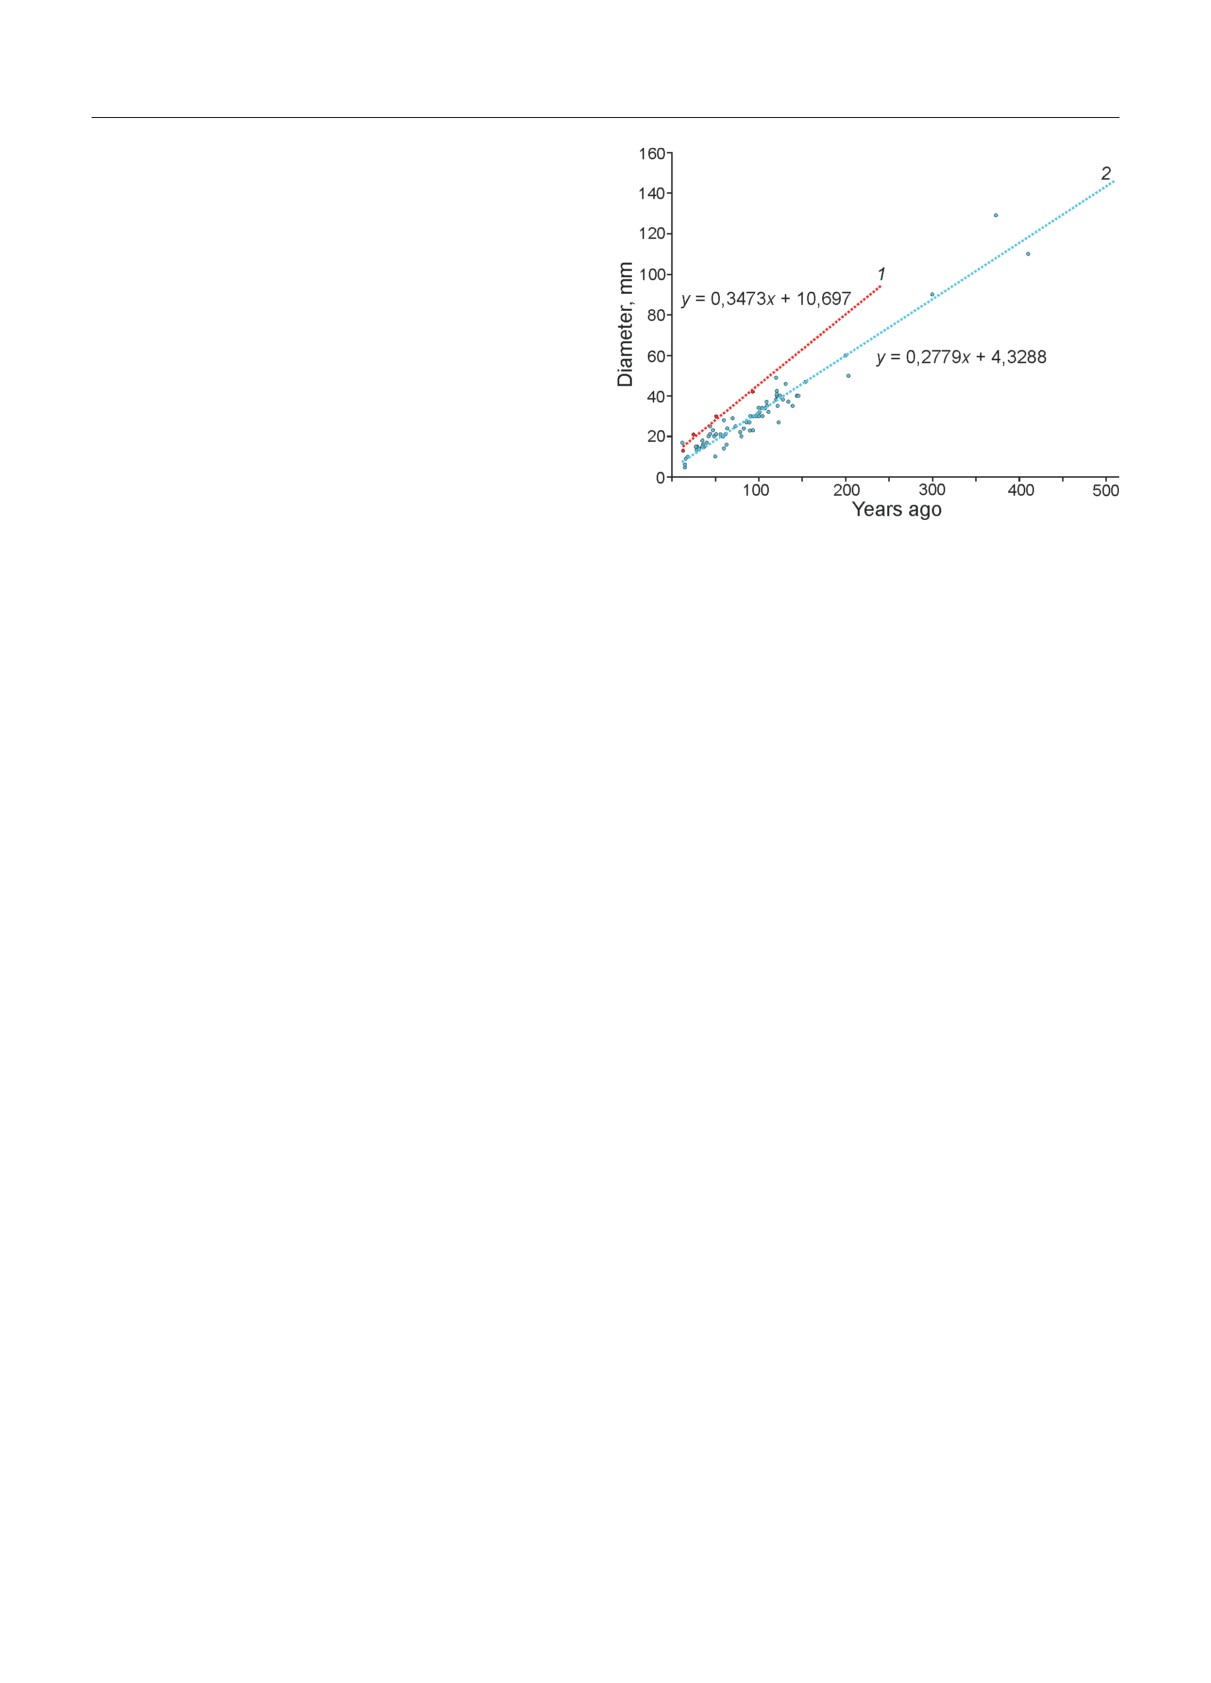
Fig. 3. Lichen growth curve developed:
of the glacier marked at the map of Rutkovskaya for
1 - for the southern [9] (brown) and 2 - northern [7] (blue)
the year 1933 dates back to 1959. Taking into account
slopes of Greater Caucasus
the correction for the height of coring (approximate
Рис. 3. Кривые роста лишайников:
1 - для южного [9] (коричневый) и 2 - северного [7] (си
ly 5 years) and the time lag between the stabiliza
ний) склонов Большого Кавказа
tion of the surface and its colonization by forest (10-
15 years) the tree-ring minimum date of this surface is
early 1930s, i.e. closely fit to the observations. At the
5.3. Lichenometric measurement. Although, for
foot of the M4 moraine ridge, at its distal side, two
the reasons discussed above, we did not produce any
pines grow, which settled here in 1926 and in 1943.
systematic lichenometric studies in this valley, some
I.e. glacier terminated here in early 1900s and the mo
data on the size of lichens seem to us worthy of dis
raine M4 (1750 m a.s.l.) was deposited slightly later,
cussion in this work. As it was described previously
most likely in the 1910s (see Fig. 2, M4).
by Solomina et al. [7], currently there are serious rea
Unfortunately, the preservation of the moraine
sons to discard all control points constraining the li
ridges in the lower part of the valley is poor. They
chen’s growth in Caucasus that are older than two to
are flattened and lost their clear outline, so it is very
three hundred years old. In general, the rough esti
difficult to trace the contours of the glacier framed
mate of the rate of Rhizocarpon geographicum growth
by them. It is likely that these surfaces are also con
in the past 100-150 years at the northern slope of the
stantly affected by slope processes and are partial
Greater Caucasus is around 0.25-0.30 mm per year.
ly eroded. We could not find old trees on the sur
The past century period characterizes the stage of the
face between moraine M6 and terminal moraines M7
fast growth of the lichens, however in the earlier time
and M8. However, fragments of moraines M7 and
the growth rate of lichens should be slower [36], but
M8 that have survived the erosion, support that old
there are no reliable control points to constrain the
trees are useful to estimate the minimum age of these
older part of the growth curve (Fig. 3). In Fig. 3 we in
generations. The oldest tree (live pine), settled on
dicated control points for the moraines of the north
moraine M7 in CE 1854. Several other old trees grew
ern slope of Greater Caucasus [7] and four points that
on this moraine in CE 1862, 1878, 1883 and 1884.
Serebryanny et al. [9] identified for the southern slope
Thus, the minimum age of this moraine should be
of the Greater Caucasus. We discarded the oldest one
approximately 180 years, i.e. the moraine was formed
for the moraine of Khalde Glacier (ca 3500 years old)
in the CE ~1840. According to the dendrochrono
that almost certainly supports the secondary gener
logical data, moraine M8 is older, where the oldest
ation of lichens and therefore is too old to be used
tree (spruce) grew in CE 1822. Other pine dates are
for lichenometry. Moreover, it has been demonstrat
CE 1858 and 1867. However, as we learnt from the
ed that the mean of five largest lichens does not fit
10Be date of this moraine this minimum age estimate
with the statistical extreme value theory and thus the
is very far from the real one and tree rings in this case
mean value is not robust [33, 34]. Fig. 3 shows that the
strongly underestimate the real age of the surface.
growth rates of the Rhizocarpon geographicum at the
461
Палеогляциология
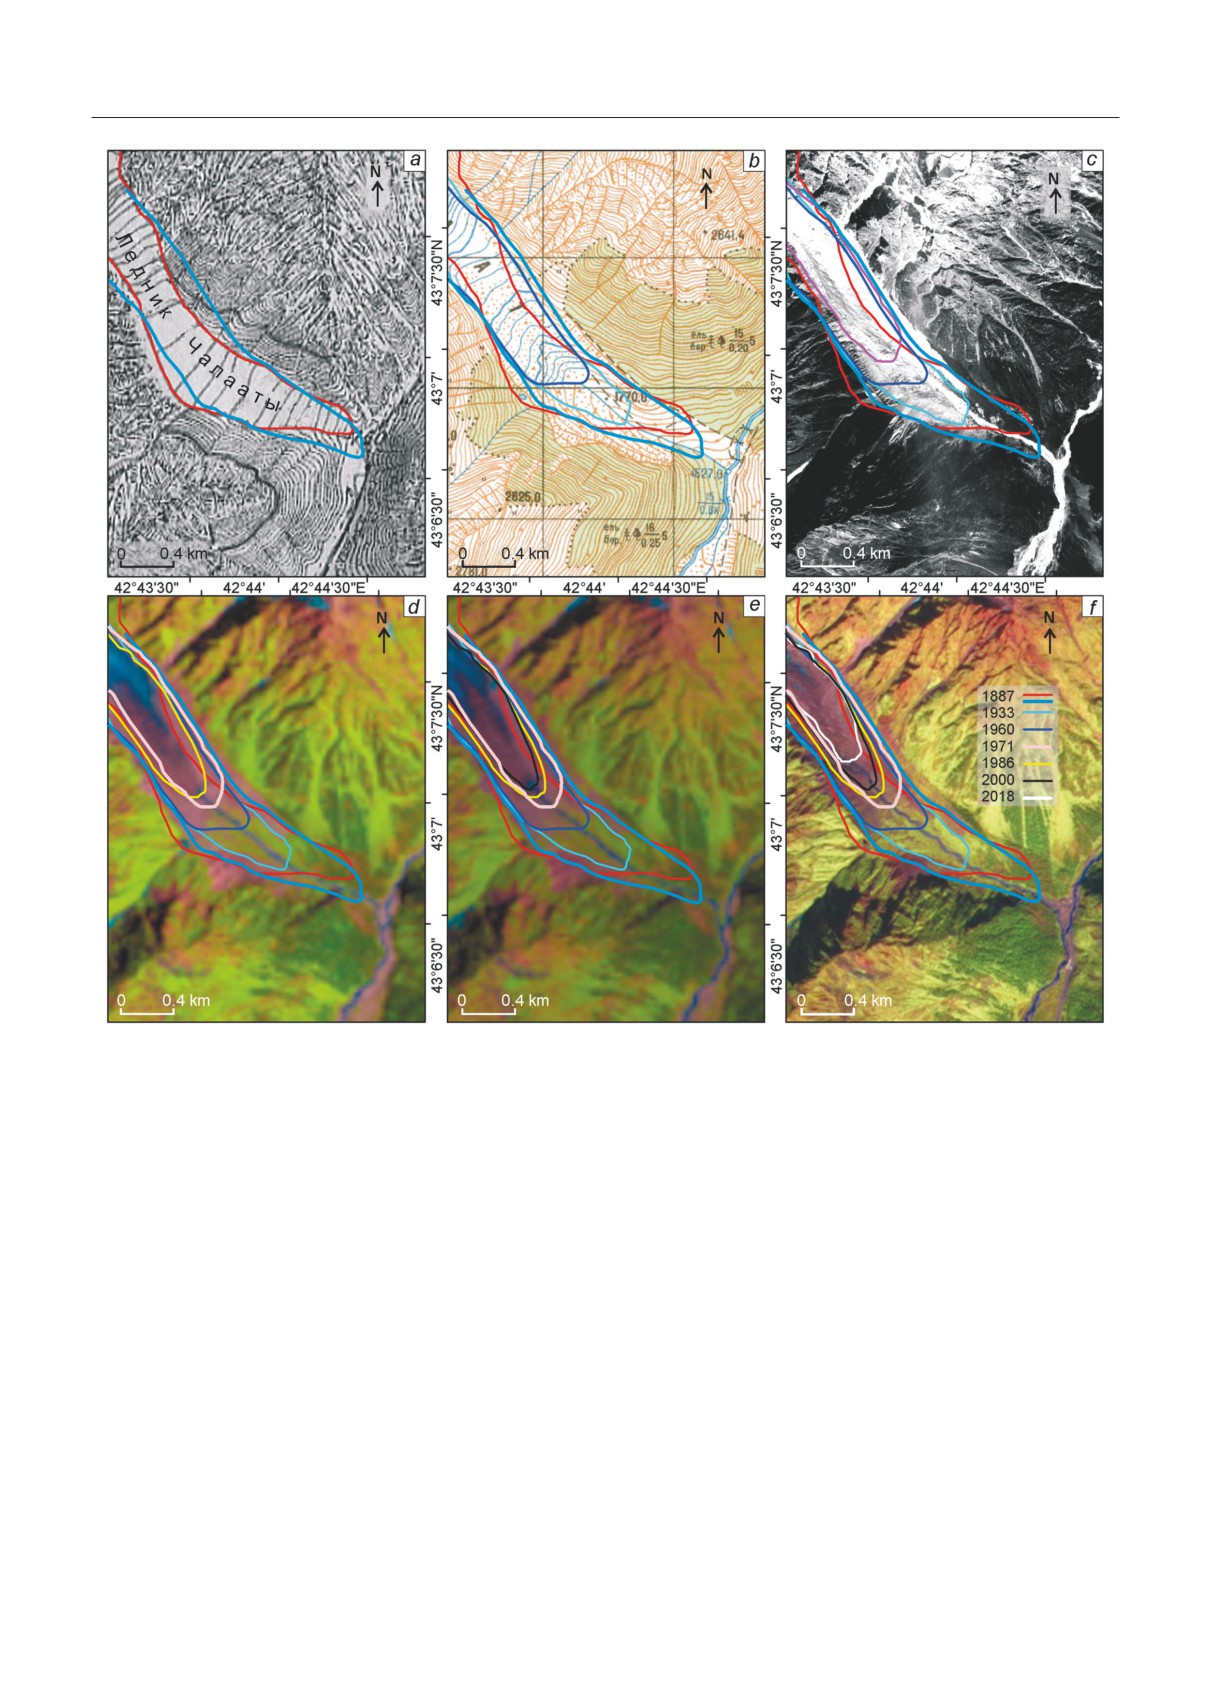
Fig. 4. Chalaati Glacier terminus change:
a - 1887 (1:84 000 scale topographic map); b - 1932 [16], 1960 (1:50 000 scale topographic map); c - 1971 (Corona, 20.09.1971);
d - 1986 (Landsat 5 TM, 06.08.1986); e - 2000 (Landsat 5 TM, 12.08.2000); f - 2018 (Sentinel 2B, 22.09.2018)
Рис. 4. Изменения конца ледника Чалаати:
a - 1887 г. (топографическая карта масштаба 1:84 000); b - 1932 г. [16], 1960 г. (топографическая карта масштаба
1:50 000); c - 1971 г. (Corona,, 20.09.1971 г.); d - 1986 г. (Landsat 5 TM, 06.08.1986 г.); е - 2000 г. (Landsat 5 TM,
12.08.2000 г.); f - 2018 г. (Sentinel 2B, 22.09.2018 г.)
southern slope is similar, but slightly higher than at the
the growth rate according to two independent studies is
northern one. This figure can be used for a rough esti
comparable. On the moraine M7, where it was possible
mate of the age of the moraines of the past one to two
to measure a sufficient number of lichens, their maxi
centuries that we are studying at Chalaati Glacier.
mum sizes were up to 65 mm (see Fig. 2). According to
On the moraines M2 and M3, which were depos
the extrapolated linear growth curve for the southern
ited about 90-100 years ago, judging by cartographic
slope, shown in Fig. 3, lichen reaches 65 mm in about
and dendrochronological data, the maximum size of
150 years. According to our dendrochronological data,
lichens is 45 mm (see Fig. 2). According to Serebryan
the minimum age of this surface is 180 years. Serebry
ny et al. [9], the lichens as large as 45 mm on the Khal
anny et al. [9] using the logarithmic curve claimed that
de Glacier moraines are also about 90 years old. Thus,
the moraines supporting the lichens of 61-63 mm on
462
L.G. Tielidze et al.
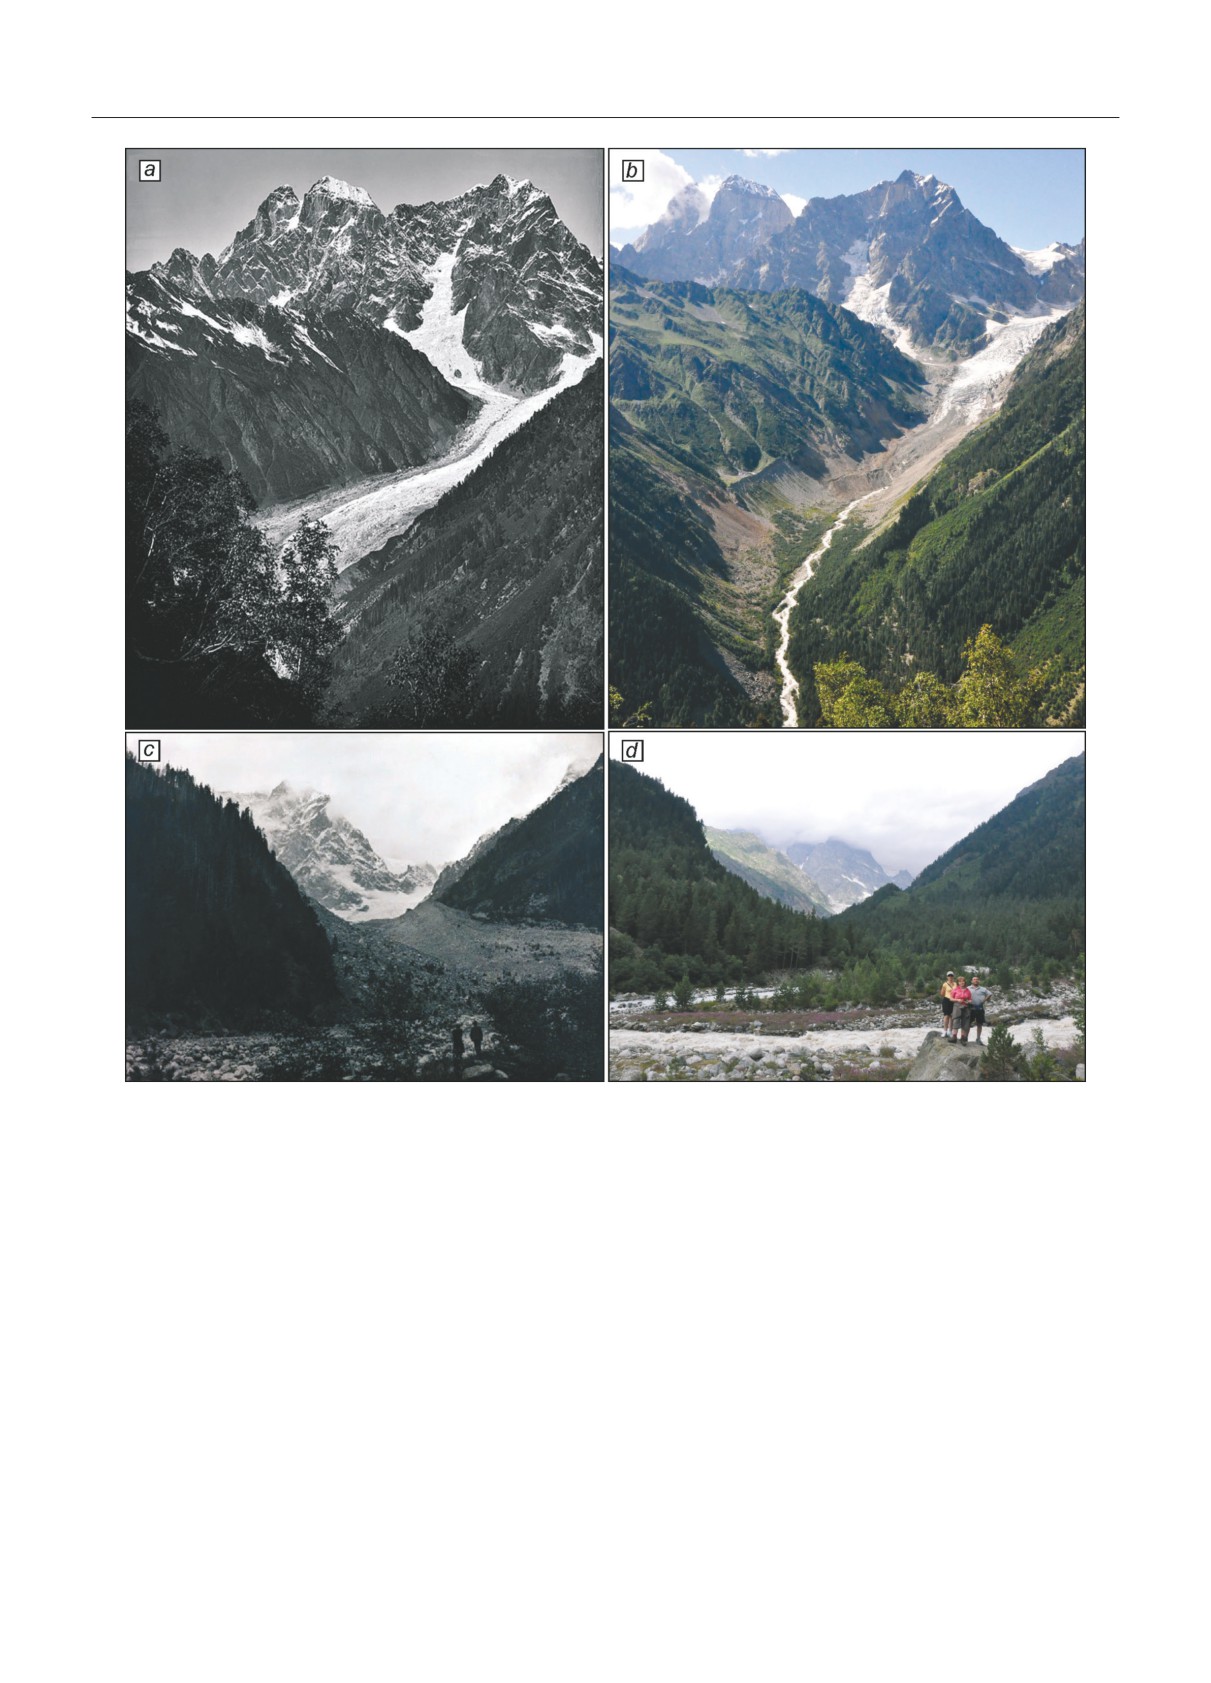
Fig. 5. Chalaati Glacier degradation between 1884 (a and c) (photos by V. Sella) and 2011 (b and d) (photos by L. Tielidze)
Рис. 5. Деградация ледника Чалаати между 1884 г. (a и c) (фото В. Селлы) и 2011 г. (b и d) (фото Л. Тиелидзе)
the southern slope dated back to the XVIII century in
lateral moraine ridge at the left side of the valley that
terval of CE 1770-1780 years. Due to the lack of re
can be seen at the map. Thus, most moraines located
liable data on the growth rate of lichens in this time
in the valley and covered by conifer forest by now were
range, no more accurate data have yet been obtained.
deposited later, after 1880s. The second attempt to co-
5.4. Old maps and repeated photos. The map of 1887
register the 1887 map to the 1960 map (see Fig. 4, b)
(Fig. 4, a) along with the moraine samples is the oldest
and satellite images (see Fig. 4, c-f) (see also chap
records that we can use for the reconstruction of glacier
ter 4.4), showed that the shape of the glacier terminus
fluctuations in XIX century. According to the map the
of the XIX century (1887) does not fit into the valley.
glacier was terminating very close (about 200 m away)
Moreover, is significantly higher than it is shown on
to the confluence of two rivers (Lekhziri and Chalaa
the map of 1887, namely in the region of the younger
ti). Its tongue occupied almost entirely the lower part
lateral moraine. This is also clearly visible in Fig. 5, b,
of the valley covering most of moraines except for one
the treeless right side of the valley. Thus, we discuss
463
Палеогляциология
Table 5. Chalaati Glacier area and terminus elevation since
Table 6. Chalaati Glacier area and length change since the
the ~1810 to the different years
~1810 according to the time periods between the dated posi-
Таблица 5. Площадь ледника Чалаати и высота его фрон-
tions of glacier terminus (the average error terms for length
та с ~1810 г. за разные годы
change are ±15 m)
Таблица 6. Изменение площади и длины ледника Чалаати
Area,
Area uncer
Terminus,
Year
Moraine
с ~1810 г. за периоды времени между датированными
km2
tainty, %
m a.s.l.
положениями его фронта (средние значения погрешно-
~1810
M8
14.9±1.5
±9.7
1620
сти для изменения длины составляют ±15 м)
~1840
M7
14.3±1.5
±10.2
1630
Time
Area
Area change,
Terminus
Terminus
1887 (~1880s)
-
14.1±1.5
±10.3
1650±100
periods
change, %
~% yr-1
change, m
change, m yr-1
~1910
M4
13.8±1.4
±10.3
1720
1810-1840
4.4±9.9
0.15
215
7.2
~1930
M3
13.6±1.4
±10.4
1730
1840-1880
1.1±10.2
0.03
185
4.6
~1940
M2
13.6±1.4
±10.4
1740
1880-1910
2.5±10.3
0.08
470
15.7
~1960
M1
12.8±0.7
±5.6
1800
1910-1930
1.2±10.3
0.06
80
4.0
1971
12.3±0.8
±6.3
1860
1930-1940
0.2±10.4
0.02
110
11.0
1986
11.6±0.7
±6.3
1900
–
1940-1960
5.6±8.0
0.28
440
22.0
2000
11.0±0.7
±6.7
1920
1960-1971
3.9±6.0
0.35
270
24.5
2018
9.9±0.5
±5.1
1980
1971-1986
5.8±6.3
0.39
135
9.0
1986-2000
5.0±6.5
0.36
80
5.7
whether to take as the basis the assumption that 1) the
2000-2018
10.2±5.9
0.57
295
16.4
terminus of the glacier on the 1887 map is correct
1810-2018
33.8±7.4
0.16
2280
11.0
ly reflected (200 m away from the two rivers conflu
ence) but the shape of the glacier tongue is distorted,
or, 2) the glacier terminus was not 200, but 500 m away
ellite imagery, which allowed us to define glacier
from the two rivers confluence. We suppose that the
change much precisely over the last half century (see
topographers of the XIX century accurately mapped
more results in the 5.5. chapter).
terminus of the glacier relative to the two rivers conflu
5.5 Glacier change since the XIII century. 10Be
ence (i.e. 200 m away), while the shape of the tongue of
CRE ages from the surface of the oldest Moraine
the glacier could be distorted.
(M8) suggest that the age of the upper glacial unit and
Photographs of Vittorio Sella of 1884, taken at
of the corresponding glacial advance is at least CE
about the same time as the map of 1887, could shed
~1300. Neither lichen nor tree ring were able to pro
light on this issue, but unfortunately, we cannot see
vide a reasonably close age estimate of this surface.
the terminus of the glacier from these positions due
The trees were too young (up to 2 hundred years old)
to the bushes and heavy debris cover (see Fig. 5,
and we did not find any lichen larger than 65 mm on
a, c). However, if we suppose that the white spot
this surface (except the one single lichen 85 mm on
that is visible though the bushes is ice (see Fig. 5, a),
the M7). The reason for this is either the lack of suit
the glacier should have been descend at least up to
able material on the surface of the moraines, specific
the lowest moraine that can be identified in a 2011
conditions for lichens slow growth (shade) or partly
photo (see Fig. 5, b). This moraine is connected to
renovated surface of the moraines. If indeed the mo
the main crest of the lateral moraine and is located
raine is 600-700 years old as we identified by 10Be the
about 450 m away from the confluence of two riv
lichens should be almost 200 mm.
ers. However, we cannot rule out that the end of the
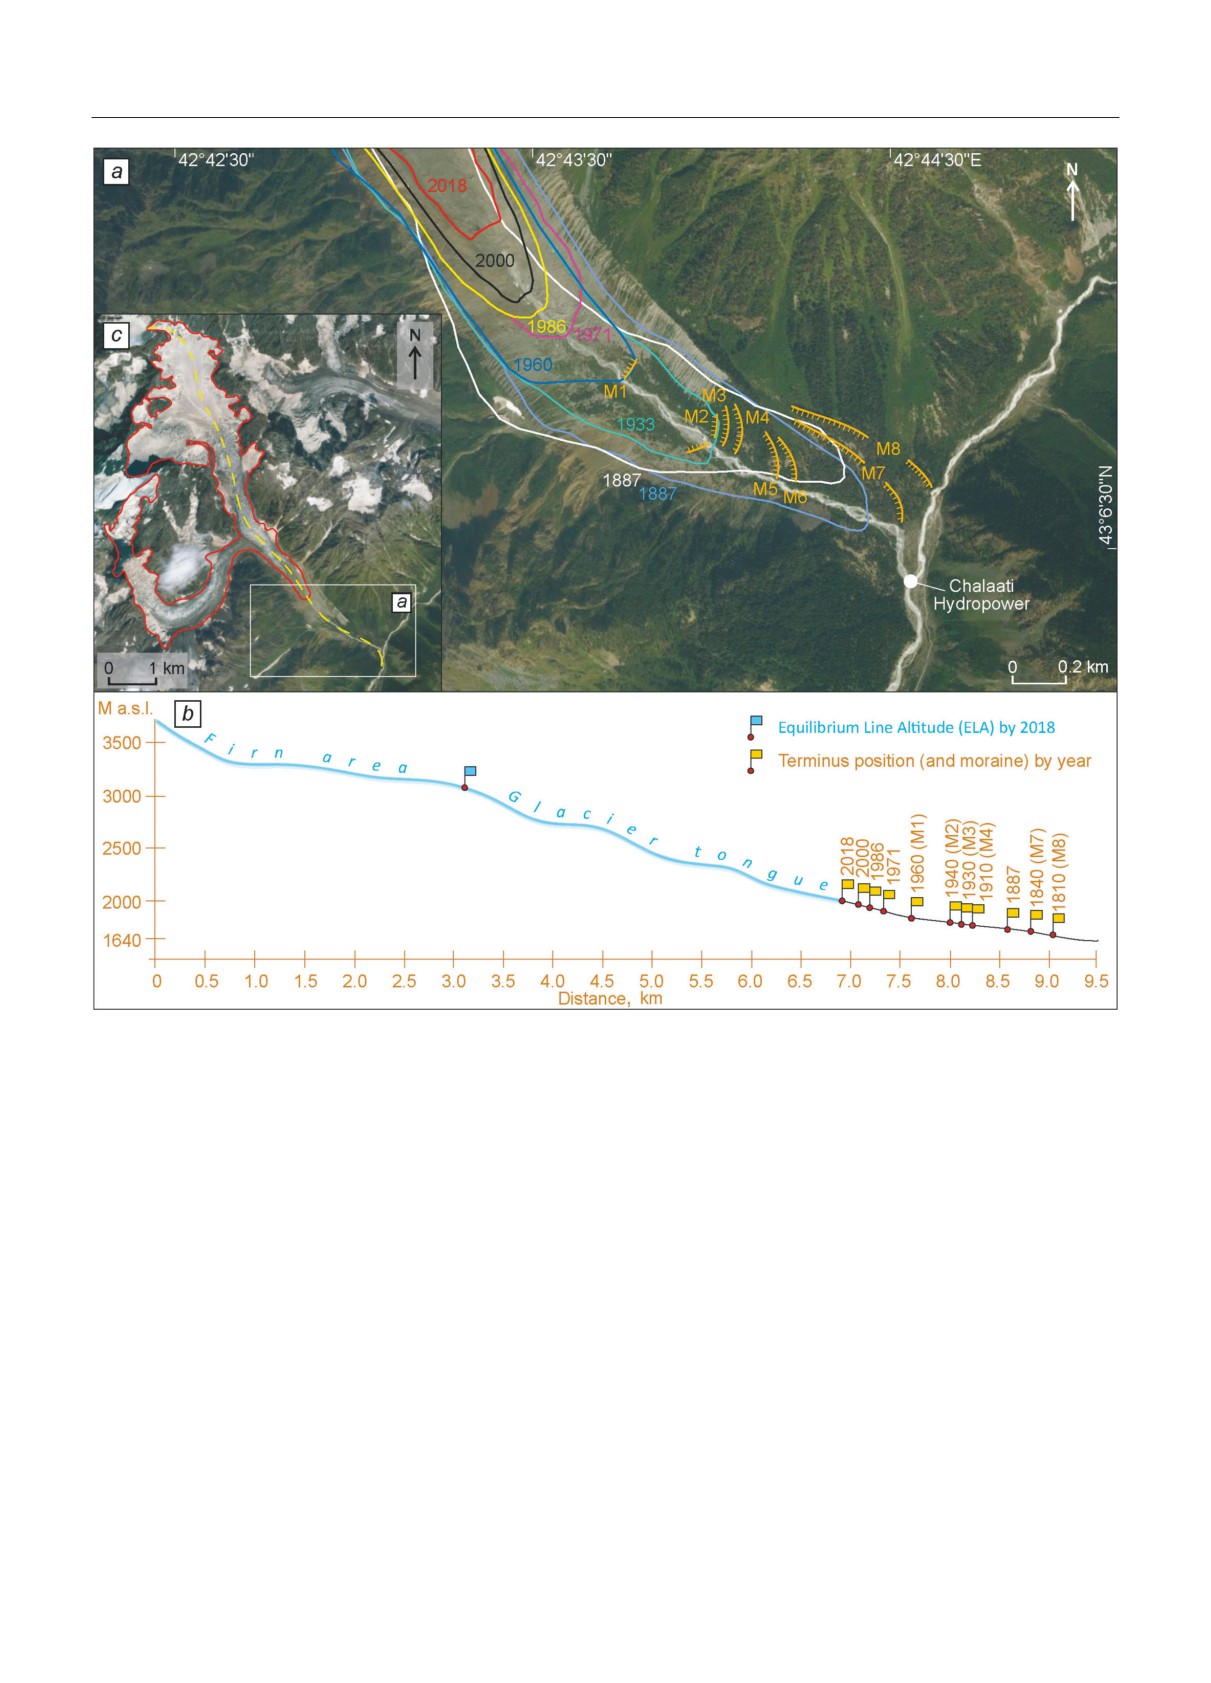
Since the ~1810 Chalaati Glacier area decreased
glacier in 1884 was located even below this position,
by 33.8±7.4% or ~0.16% yr-1 from 14.9±1.5 km2 to
as we cannot see it in the 1884 photos. Thus, the his
9.9±0.5 km2 while its terminus elevation rose from
torical material from 1880s does not provide precise
~1620 m to ~1980 m during the same time (Table 5;
evidence where the Chalaati Glacier was exactly ter
Fig. 6). While area was decreasing, Chalaati Gla
minated at that time. However, as no other data exist
cier retreated steadily over the past two centuries.
from this time, this map is the only source for this re
The most intense retreats occurred in ~1880-1910,
search to establish century-long trend glacier change.
1940-1971, and 2000-2018, while the slowest re
Unlike the XIX century map, the large-scale top
treats have been recorded in ~1840-1880, 1910-
ographic map from 1960 is consistent with all sat
1930, and 1986-2000 (Table 6). According to the
464
L.G. Tielidze et al.
Fig. 6. Chalaati Glacier change (а) since the Little Ice Age (GeoEye 2014 image is used as background).
Different colors of outlines show glacier margins in different years. Moraine M8 corresponds to the CE 1810; M7 - 1840; M4 -
1910; M3 - 1930; M2 - 1940; M1 - 1960.; b - Chalaati valley longitudinal profile (based on ASTER GDEM, 2011) and Chalaati
Glacier terminus positions according to the different years; c - yellow dotted line shows Chalaati valley longitudinal profile.
Рис. 6. Сокращение ледника Чалаати (a) после малого ледникового периода (изображение GeoEye 2014 ис
пользовано в качестве фона).
Различные цвета контуров показывают края ледника в разные годы. Морена М8 соответствует CE 1810 г.; М7 - 1840 г.;
М4 - 1910 г.; М3 - 1930 г.; М2 - 1940 г.; М1 - 1960 г.; b - продольный профиль долины Чалаати (по дан
ным ASTER GDEM, 2011 г.) и положение конца ледника Чалаати в разные годы; c - жёлтая пунктирная линия показы
вает продольный профиль долины Чалаати
previous detailed field measurement of the termi
with retreat measurement by Tsereteli [17], accord
nus position of Chalaati, the retreat in 1990s was in
ing to which, the Chalaati Glacier has retreated over
terrupted by an advance. Microstadial moraines in
more than 1000 m from 1890s to 1960s.
front of Chalaati Glacier confirm ~20 m glacier ad
Unlike the other investigated periods, glacier area
vance during 1990-1993 [11] that gives a confidence
loss rates over the last three decades (since the 1986)
in our measurements (small retreat rates between
are much higher compared to the relative terminus
years 1986 to 2000). Moreover, Chalaati Glacier re
retreat rates (see Table 6), suggesting that the glacier
treat between 1880s and 1960s (~1100 m) is in line
area decrease over this time period progressing not
465
Палеогляциология
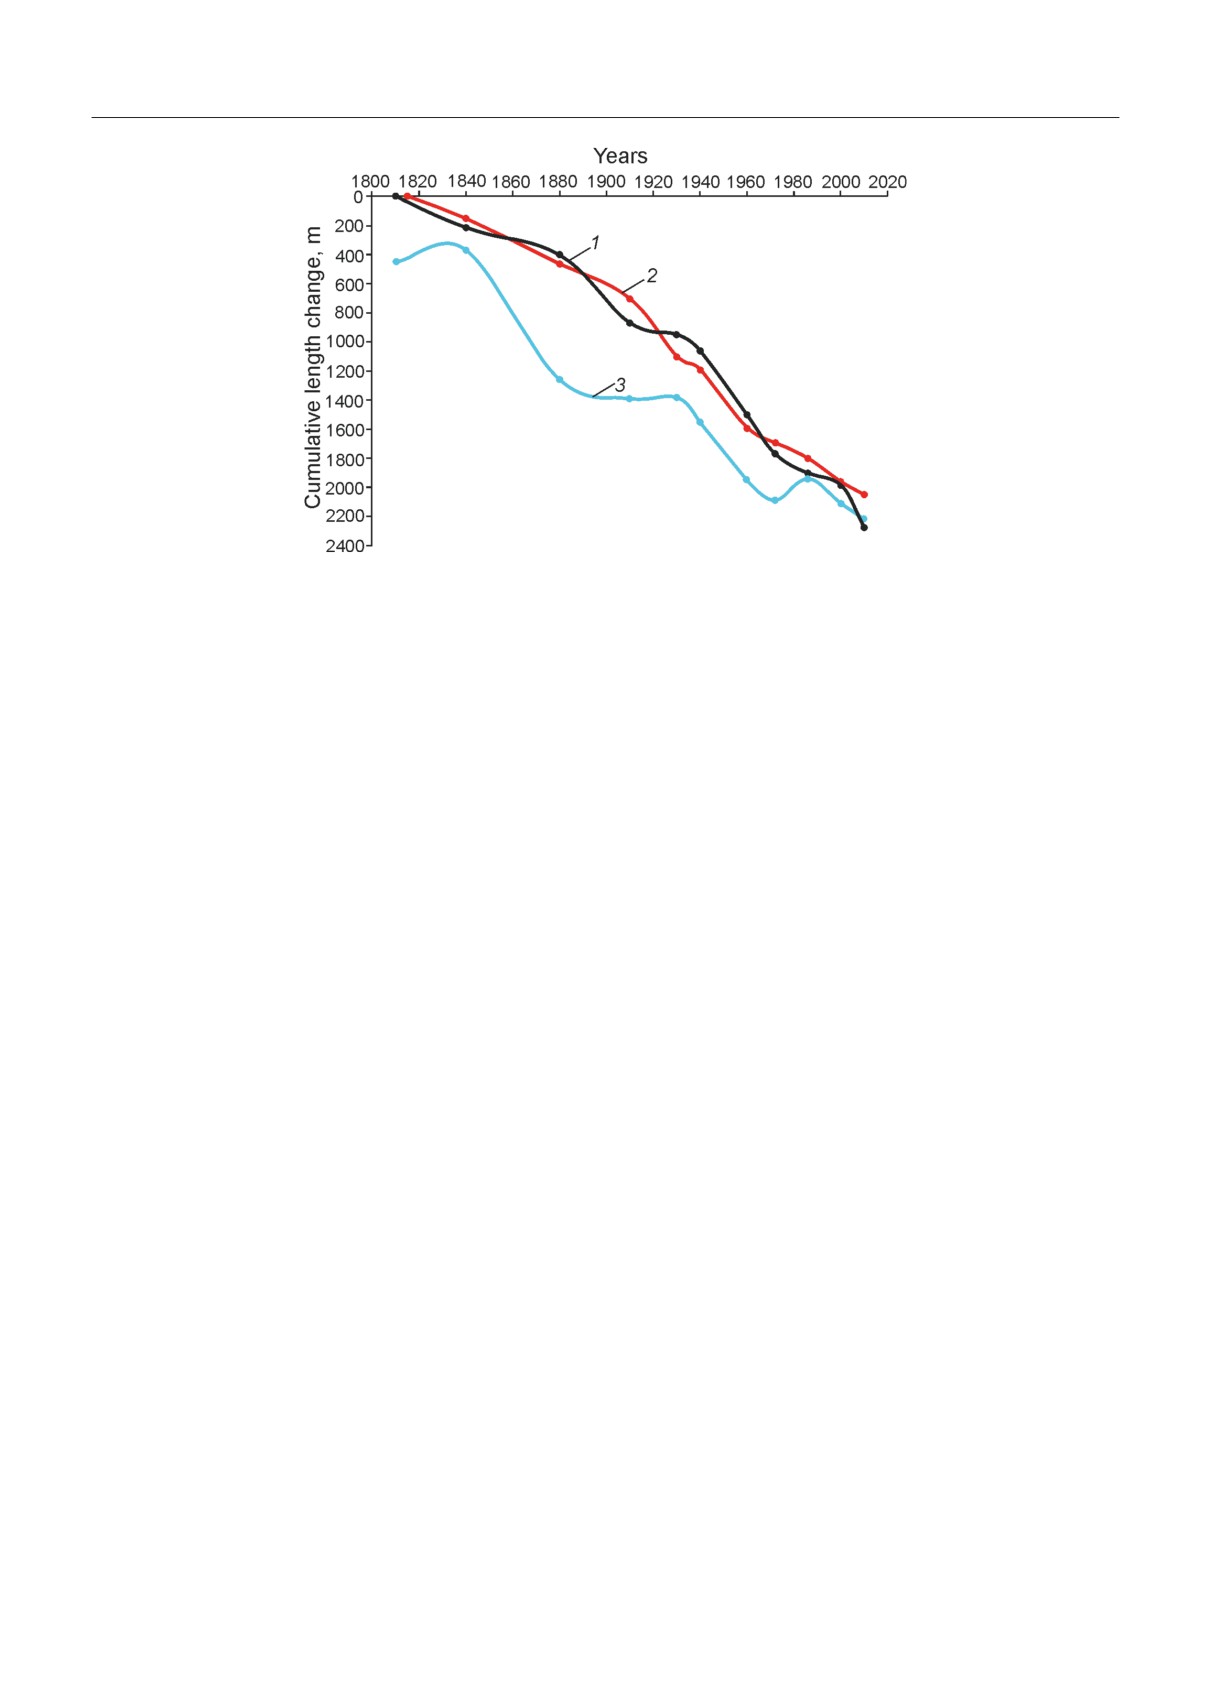
Fig. 7. Comparison of cumulative curves of terminus changes:
1 - for the Chalaati Glacier; 2 - for the Tsey Glacier in the northern Greater Caucasus [7]; 3 - Mer de Glace Glacier in the
French Alps [40]
Рис. 7. Сравнение кумулятивных кривых изменения длины ледников:
1 - ледник Чалаати; 2 - ледник Цей на северном макросклоне Большого Кавказа [7]; 3 - ледника Мер-де-Глас во Фран
цузских Альпах [40]
only the terminus expense but also upper bodies of
of the Greater Caucasus. e.g. according to Solomi
the glacier. This can be the result of the supra-glacial
na et al. [7] general glacier retreat on the northern
debris cover area and thickness increase near the ter
slope started in the late 1840s. Four to five minor re-
minus similar to some glaciers of the Greater Cau
advances occurred in the period between CE 1860s
casus (e.g. Djankuat Glacier, [37]) which became
and 1880s and three re-advances or steady states in
more pronounced after 2000 [12]. We note that this
1910s, 1920s and 1970s-1980s, which again are agree
requires more detail investigation and it can be the
ment with lowest retreat rates or steady states be
topic of the future study. Even though the century
tween ~1840-1880 (~4.63 m yr-1) and 1910-1930
long trend of glacier retreat is global, and the rate of
(~4.0 m yr-1) of the Chalaati Glacier. In addition,
this retreat has increased in the past few decades, the
these recorded length changes of Chalaati Glacier are
retreat trend between 1940 and 1971 is unusual for
quite similar to changes observed in similar size Tsey
Chalaati Glacier in the context of the past two centu
Glacier (northern counterpart) over the past two cen
ries and it requires additional research.
turies [7], while these are quite different to chang
5.6. Comparison with other glaciers. The 10Be
es observed in the Mer de Glace Glacier (France)
CRE ages are in line with global trends [2] of gla
with several advance phases since the beginning of the
cier advances in the second half of the Holocene and,
XIX century [40] (Fig. 7). However, to be more ro
in particular, during the Little Ice Age. The early
bust, all these comparisons at the regional scale of the
advance of Chalaati Glacier 600-700 years ago is
Georgian Caucasus need more data collection, obser
broadly consistent with minimum 14C age for a mo
vations, and enhanced chronology that had to be con
raine in the Bezengi Valley on the northern slope of
fronted to those obtained in other mountain ranges.
the Greater Caucasus (CE 1245-1428) [9]. Chalaati
advances are also in phase with other studies from the
European Alps, where the general advance is docu
6. Conclusions
mented in the late XIII century that culminated be
tween CE ~1350 and ~1385 at Great Aletsch, Gorner
We present the first Chalaati Glacier variations
(Switzerland) [38], and Mer de Glace (France) [39].
analysis including multitemporal data sets covering
The dendrochronological data of this study also
the time period since the Little Ice Age. In situ 10Be
fits to other investigation from the northern slope
CRE ages, dendrochronology, lichenometry, along
466
L.G. Tielidze et al.
with the manual digitization from 1887 and 1960s
ers, Dmitry Petrakov and anonymous reviewer 2, for
topographic maps and satellite imagery from 1971
detailed comments which clearly enhanced the qual
(Corona), 1986, 2000 (Landsat 5) and 2018 (Senti
ity of the paper. Special thanks to Lauren Vargo and
nel) were used to map the glacier surface area to sub
Regis Braucher for proofreading the paper.
stantially improve the regional existing knowledge.
The main study findings can be summarized as
Благодарности. Проект выполнен в рамках Гос
follows:
задания № 0148-2019-0004 и российско-фран
1) based on in situ 10Be CRE ages, the Chalaati
цузского (CNRS-PICS) совместными програм
Glacier reached its maximum extent in the past mil
мами (DECAU; IPAGCAUA) и программой
lennium probably at the onset of an early Little Ice
LIA DEGLAC. Исследование с грузинской сто
Age 0.73±0.04 kyr ago (CE ~1250-1330), even if
роны поддержано Национальным научным
more data are needed to get a better constrain on the
фондом Грузии им. Шота Руставели
age of this advance. This maximum extent recorded
(SRNSFG) [YS17_12]. Измерения 10Be прово
in this paper corresponds to moraine M8;
дились на национальном объекте ASTER AMS
2) according to minimum tree-ring dates, the
(CEREGE. Экс-ан-Прованс), который поддер
same oldest terminal moraine (M8) date back to the
живается INSU/CNRS, ANR в рамках програм
very beginning of the 19th century (~1810), while the
мы «Projets thématiques d'Excellence» для
second oldest moraine formed in the ~1840 (M7).
«Equipements d'excellence» ASTER - CEREGE
Moraines from the 20th century were dated as ~1910
и IRD. В состав команды ASTER входят Жорж
(M4) ~1930 (M3), ~1940 (M2), and ~1960 (M1);
Ауматр, Дидье Л. Бурлес, Карим Кеддадуш.
3) since the ~1810, Chalaati Glacier decreased
Мы благодарны двум рецензентам, Дмитрию
by 33.8±7.4% (~0.16% yr-1) with highest decrease
Петракову и А.М. Грачеву, за подробные ком
rates in 1971-1986 (~0.39% yr-1) and 2000-2018
ментарии, которые значительно улучшили ка
(~0.57% yr-1), while the lowest rates in 1840-1880
чество статьи. Выражаем также благодарность
(~0.03% yr-1) and in 1910-1940 (~0.04% yr-1);
Лорен Варго и Реджису Браухеру за помощь в
4) over the last two centuries glacier terminus re
правке текста.
treated by about 2280 m with highest retreat rates
in 1940-1971 (~22.9 m yr-1) and in 2000-2018
(~16.4 m yr-1), while the lowest rates in ~1840-1880
Расширенный реферат
(~4.6 m yr-1) and in 1986-2000 (~5.7 m yr-1).
Future studies can be focused in collection of
Лихенометрические исследования морен ма
more data from other glacier valleys in order to bet
лого ледникового периода у ледников южного
ter define the Little Ice Age glacier extend in region
макросклона Большого Кавказа, выполненные
al context.
Н.А. Голодковской в 1980-х годах [9], факти
чески, единственный источник информации о
Acknowledgements. The project is supported by the
времени наступаний этих ледников в прошлом.
fundamental scientific research № 0148-2019-0004
В этой работе авторы приводят первые датиров
and Russian-French (CNRS-PICS) collaborative
ки морен ледника Чалаати в Сванетии, возраст
programs (DECAU; IPAGCAUA) and LIA program
которых определён с помощью космогенных
DEGLAC. The study from Georgian side was sup
изотопов бериллия 10Be. Кроме того, для опре
ported by Shota Rustaveli National Science Founda
деления времени и масштабов колебания лед
tion of Georgia (SRNSFG) [YS17_12]. The 10Be
ника Чалаати (Грузия) в прошлом были исполь
measurements were performed at the ASTER AMS
зованы космические снимки (Corona, Landsat 5
national facility (CEREGE. Aix-en-Provence) that is
TM и Sentinel 2B), старые карты (1887, 1933,
supported by the INSU/CNRS, the ANR through
1960 гг.), повторные фотографии, дендрохро
the «Projets thématiques d’excellence» program for
нология и лихенометрия. Исторические свиде
the «Equipements d’excellence» ASTER-CEREGE
тельства о положении конца ледника имеют
action and IRD. ASTER Team includes Georges
ся для 1868 г. [14] (1585 м), 1905 г. [15] (1628 м),
Aumaître, Didier L. Bourlès, Karim Keddadouche.
1933 г. [16] (1738 м), 1959 г. [18], 1980 г. [20]
We gratefully acknowledge the support of two review
(1880 м), 2011 г. [13] (1950 м).
467
Палеогляциология
Три пробы на 10Be были отобраны ручным
ны на горизонтальной поверхности дисталь
молотком и долотом в сентябре 2018 г. с гори
ной левой береговой морены М8 (см. рис. 2) на
зонтальных и субгоризонтальных верхних по
анализ 10Be, имеют возраст 4,2±0,65, 0,79±0,08
верхностей крупных валунов высотой более
и 0,67±0,1 тыс. лет. Возраст 4,2 тыс. л.н. мы
60 см, расположенных на самой внешней море
сочли аномальным (возможно, из-за наследо
не на левом борту долины. Валуны были устой
вания сигнала). Образцы Gео 1 и Gео 3 дают
чивыми и не имели признаков поверхностной
средний возраст 10Be в интервале 1250-1330 гг.
эрозии. Координаты и высоты образцов реги
и означают образование морены M8 в нача
стрировались с помощью портативного GPS, а
ле малого ледникового периода. Однако из-за
топографическую экранировку (линию горизон
очень ограниченного числа проб средний воз
та) определяли с помощью клинометра и компа
раст морены по 10Be должен рассматриваться
са. Образцы обрабатывали в лаборатории CALM
как предварительный. По своим масштабам это
lab (Cosmonucléides Au Laboratoire de Meudon-
наступание в малом ледниковом периоде было
France). Длина ледников определялась в соот
максимальным. Второй максимум, когда лед
ник достиг почти такой же длины, датируется
com). Самый длинный поток ледника опреде
примерно 1810 г.
лялся вручную как перпендикуляр высотным
Таким образом, ледник Чалаати на южном
контурам. Измерения положения фронта ледни
склоне Кавказа наступал примерно в то же
ка проводили с использованием контуров лед
время, что и ледники в Альпах и других гор
ника для каждой даты, вдоль ледового фронта -
ных странах Северного полушария. С этого
перпендикулярно течению.
времени до 2018 г. площадь ледника уменьши
Мы оценили неопределённости вычисления
лась с 14,9±1,5 км2 до 9,9±0,5 км2 (33,8±7,4%,
площади ледника буферным методом. Ошиб
или ~0,16% год-1), а его длина сократилась
ки определений площади ледника составили
на ~2280 м. Скорость отступания была не
±5,6% для 1960 г., ±6,3% для 1972 и 1986 гг. и
равномерной: она достигла максимума между
±6,7% для 2000 г. (размер буфера ±30 м), в то
1940 и 1971 г. (~22,5 м год-1), самая медлен
время как неопределённость составила ±5,1%
ная скорость отступания была в 1910-30-х
для 2018 г. (размер буфера ±20 м). Три образ
годах (~4,0 м год-1). Высота конца поднялась с
ца породы (см. табл. 3), которые были отобра
~1620 м до ~1980 м в период с 1810 по 2018 г.
References
tuations. Climate Dynamics. 2012, 38: 1065e1079.
1. Matthes F.E. Report of the committee on glaciers, 1939-
5. Bushueva I.S. Kolebaniya lednikov na Tsentralnom i Za-
40. Transactions of the American Geophys. Union.
padnom Kavkaze po kartograficheskim, istoricheskim i
bioindikatsionnym dannym za poslednie 200 let Fluctua
Report-Committee-Glaciers-1939-40.
tions of glaciers on the Central and Western Caucasus
2. Solomina O.N., Bradley R.S., Jomelli V., Geirsdottir A.,
using cartographical, historical and proxy data over the
Kaufman D.S., Koch J., McKay N.P., Masiokas M., Mill-
last 200 years). PhD Thesis. 2013. Moscow: Institute of
er G., Nesje A., Nicolussi K., Owen L.A., Putnam A.E., Wan-
Geography Russian Academy of Sciences, Russia [In
ner H., Wiles G., Yang B. Glacier fluctuations during the
Russian].
past 2000 years. Quaternary Science Reviews. 2016, 149:
6. Solomina O.N., Bushueva I.S., Kuderina T.M., Mats-
kovsky V.V., Kudikov A.V. Holocene history of the Ul
3. Neukom R., Gergis J., Karoly D., Wanner H., Curran M.,
lukam Glacier. Ice and Snow. 2012, 1 (117): 85-94.
Elbert J., González-Rouco F., Linsley B.K., Moy A.D.,
Mundo I., Raible C.C., Steig E., van Ommen T.,
[In Russian].
Vance T., Villalba R., Zinke J., Frank D. Interhemi
7. Solomina O.N., Bushueva I., Dolgova E., Jomelli V.,
spheric temperature variability over the past millenni
Alexandrin M., Mikhalenko V., Matskovsky V. Gla
um. Nature climate change. 2014, 4: 362-367. https://
cier variations in the Northern Caucasus compared
doi.org/10.1038/nclimate2174.
to climatic reconstructions over the past millenni
4. Leclercq P.W., Oerlemans J. Global and hemispheric
um. Global Planetary Change. 2016, 140: 28-58. doi.
temperature reconstruction from glacier length fluc
org/10.1016/j.gloplacha.2016.02.008.
468
L.G. Tielidze et al.
8. Solomina O.N., Bushueva I.S., Polumieva P.D., Dolgo-
20. Gobejishvili R.G. Present day glaciers of Georgia and
va E.A., Dokukin M.D. History of the Donguz-Orun
evolution of glaciation in the mountains of Eurasia in
Glacier from bioindication, historical, cartographic
late Pleistocene and Holocene. PhD. Tbilisi, Institute
sources and remote sensing data. Ice and Snow. 2018,
of Geography, Georgian National Academy of Scienc
58 (4): 448-461. doi.org/10.15356/2076-6734-2018-4-
es. 1995: 320 p. [In Georgian].
448-461. [In Russian].
21. Podozersky K.I. Glaciers of the Caucasian Range. Za-
9. Serebryanyi L.R., Golodkovskaya N.A., Orlov A.V.,
piski Kavkazskogo otdela Russkogo Geograficheskogo
Malyasova E.S., Ilves E.O. Kolebaniya lednikov i
Obshchestva. Proc. of the Caucasian Branch of the
protsessy morenonakopleniya na Tsentral’nom Kavka-
Russian Geographical Society. 1911, 29 (1): 200 p. [In
ze. Fluctuations of glaciers and processes of moraines
Russian].
formation in the Central Caucasus. Moscow: Nauka,
22. Klein M.G., Gottdang A., Mous D.J.W., Bourlès D.L.,
1984: 216 p. [In Russian].
Arnold M., Hamelin B., Aumaître G., Braucher R., Mer-
10. Tielidze L.G. Glacier change over the last centu
chel S., Chauvet F. Performance of the HVE 5MV AMS
ry, Caucasus Mountains, Georgia, observed from
system at CEREGE using an absorber foil for isobar
old topographical maps, Landsat and ASTER satel
suppression. Nuclear Instruments and Methods in
lite imagery. The Cryosphere. 2016, 10: 713-725. doi.
Physics Research Section B: Beam Interactions with
org/10.5194/tc-10-713-2016.
Materials and Atoms. 2008, 266: 1828-1832. https://
11. Tielidze L.G. and Wheate R.D. The Greater Cauca
doi.org/10.1016/j.nimb.2007.11.077.
sus Glacier Inventory (Russia, Georgia and Azerbai
23. Braucher R., Guillou V., Bourlès D.L., Arnold M., Au-
maître G., Keddadouche K., Nottoli E. Preparation of
org/10.5194/tc-12-81-2018.
ASTER in-house 10Be/9Be standard solutions // Nu
12. Tielidze L.G., Bolch T., Wheate R.D., Kutuzov S.S.,
clear Instruments and Methods in Physics Research
Lavrentiev I.I., Zemp M. Supra glacial debris cover
Section B: Beam Interactions with Materials and
changes in the Greater Caucasus from 1986 to 2014.
nimb.2015.06.012.
org/10.5194/tc-14-585-2020.
24. Chmeleff J., von Blanckenburg F., Kossert K., Jakob D.
13. Tielidze L.G. Dynamics of the Glaciers of Georgia.
Determination of the 10Be half-life by multicollec
Glaciers of Georgia. Geography of the Physical Envi
tor ICP-MS and liquid scintillation counting // Nu
ronment. Springer, Cham., 2017. doi.org/10.1007/978-
clear Instruments and Methods in Physics Research
3-319-50571-8_5.
Section B: Beam Interactions with Materials and
14. Freshfield D.W. The Exploration of the Caucasus.
1896. V. II. Edinburgh: T. and A. Constable, printers to
nimb.2009.09.012.
her majesty. London and New York.
25. Martin L.C.P., Blard P.-H., Balco G., Lavé J., Delunel R.,
15. Déchy M. von. Kaukasus Reisen und Forschungen im
Lifton N., Laurent V. The CREp program and the ICE-D
kaukasischen Hochgebirge (Travel and research in the
production rate calibration database: A fully parameter
Caucasian high mountains). 1905. Berlin, Band 1:
izable and updated online tool to compute cosmic-ray
313-314. [In German].
exposure ages. Quaternary Geochronology. 2017, 38:
16. Rutkovskaya V.A. Sections: Upper Svaneti Glaciers.
Transactions of the glacial expeditions. 1936, 5: 404-
26. Young N.E., Schaefer J.M., Briner J.P., Goehring B.M.
448.
A 10Be production-rate calibration for the Arc
17. Tsereteli D. Glacier change in the southern slope of the
tic: A 10Be production-rate calibration for the Arc
Greater Caucasus during the last 20-25 years). Works
tic. Journ. of Quaternary Science. 2013, 28: 515-526.
of Georgian National Academy of Sciences (Moam
be). 1959, XII (6). [In Georgian].
27. Lal D. Cosmic ray labeling of erosion surfaces: in situ
18. Tsereteli D., Khazaradze R., Lomtatidze G., Inashvi-
nuclide production rates and erosion models. Earth
li Sh., Lashkhi T., Kurdghelaidze G., Kalandadze G.
Planetary Science Letters. 1991, 104: 424-439. https://
and Chekurishvili R. Glaciological observations on the
doi.org/10.1016/0012-821X(91)90220-C.
Chalaati and Lechziri Glaciers (Upper Svaneti) in the
28. Stone J.O. Air pressure and cosmogenic isotope pro
spring of 1959. Georgian National Academy of Scienc
duction // Journ. of Geophys. Research. 2000, 105:
es. Works of Vakhushti Institute of Geography. 1962,
XVIII: 223-256. [In Georgian].
29. Stokes M.A., Smiley T.L. An Introduction to Tree-Ring
19. Shengelia R. Chalaati and Lekhziri glaciers regime in
Dating. University of Chicago Press. Chicago. 1968,
the summer of 1961. Georgian National Academy of
II: 73 p.
Sciences. Works of Vakhushti Institute of Geography.
30. Bushueva I.S., Solomina O.N. Kashkatash Glacier
1964, XX: 233-244. [In Georgian].
fluctuations in the XVII-XI centuries from carto
469
Палеогляциология
graphic, dendrochronological and lichenometric
35. Granshaw F.D., Fountain A.G. Glacier change (1958-
data. Ice and Snow. 2012, 52 (2): 121-130. https://
1998) in the North Cascades National Park Complex,
doi.org/10.15356/2076-6734-2012-2-121-130. [In
Washington, USA. Journ. of Glaciology. 2006, 52:
Russian].
251-256. doi: 10.3189/172756506781828782.
31. Beschel R.E. Flechten als Altersmaßstab rezenter
36. Innes J.L. Lichenometry. Progress in Physical Geogra
Moränen. Zeitschrift für Gletscherkunde und Ge
phy. 1985, 9 (2): 187-254.
ologie. 1950, 1: 152-162 (In German, translated by
37. Popovnin V.V., Rezepkin A.A., Tielidze L.G. Superficial
Barr W., Lichens as a measure of the age of recent mo
moraine expansion on the Djankuat Glacier snout over
raines. Arctic and Alpine Research. 1973, 5: 303-309).
the direct glaciological monitoring period. Earth Cryo
32. Osborn G., Menounos B., Ryane C., Riedel J.,
sphere. 2015, XIX (1): 79-87.
Clague J.J., Koch J., Clark D., Scott K., Davis P.T.
38. Holzhauser H., Magny M., Zumbühl H.J. Glacier and
Latest Pleistocene and Holocene glacier fluctuations
lake-level variations in west-central Europe over the
on Mount Baker, Washington. Quaternary Sciences
last 3500 years. Holocene. 2005, 15 (6): 789-801.
Review. 2012, 49: 33-51. doi.org/10.1016/j.quasci
rev.2012.06.004.
39. Le Roy M., Nicolussi K., Deline P., Astrade L., Ed-
33. Jomelli V., Grancher D., Naveau P., Cooley D. As
ouard J.L., Miramont C., Arnaud F. Calendar-dated
sessment study of lichenometric methods for dating
glacier variations in the Western European Alps during
surfaces. Geomorphology. 2007, 86: 131-143. doi.
the Neoglacial: the Mer de Glace record, Mont Blanc
org/10.1016/j.geomorph.2006.08.010.
massif. Quaternary Sciences Review. 2015, 108: 1-22.
34. Naveau P., Jomelli V., Cooley D., Grancher D. Rabatel A.
Modelling uncertainties in lichenometry studies with
40. Zumbühl H.J., Steiner D., Nussbaumer S.U. 19th century
an application: The Tropical Andes (Charquini Gla
glacier representations and fluctuations in the central
cier in Bolivia). Arctic, Antarctic and Alpine Research.
and western European Alps: an interdisciplinary ap
proach. Glob. Planetary Changes. 2008, 60 (1): 42-57.
0430(2007)39[277:MUILS]2.0.CO;2.
470