Лёд и Снег · 2020 · Т. 60 · № 3
УДК 551.515.6
doi: 10.31857/S2076673420030049
The relationship between methane transport to the atmosphere and the decay
of the Kara Sea ice cover: satellite data for 2003-2019
L.N. Yurganov
University of Maryland Baltimore County, Baltimore, USA
Yurganov@umbc.edu
Связь между переносом метана в атмосферу и разрушением ледяного покрова
Карского моря: спутниковые данные за 2003-2019 гг.
© 2020 г. Л.Н. Юрганов
Мэрилендский университет, Балтимор, США
Yurganov@umbc.edu
Received February 3, 2020 / Revised April 12, 2020 / Accepted June 7, 2020
Keywords: Arctic climate, greenhouse gases, methane, satellite data, sea ice.
Summary
Satellite spectrometers operating on the outgoing long-wave IR (thermal) radiation of the Earth and placed in sun-
synchronous polar orbits provide a wealth of information about Arctic methane (CH4) year-round, day and night.
Their data are unique for estimating methane emissions from the warming Arctic, both for land and sea. The article
analyzes concentrations of methane obtained by the AIRS spectrometer in conjunction with microwave satellite mea-
surements of sea ice concentration. The data were filtered for cases of sufficiently high temperature contrast in the
lower atmosphere. The focus is on the Kara Sea during autumn-early winter season between 2003 and January 2019.
This sea underwent dramatic decline in the ice cover. This shelf zone is characterized by huge reserves of oil and natu-
ral gas (~90% methane), as well as presence of sub-seabed permafrost and methane hydrates. Seasonal cycle of atmo-
spheric methane has a minimum in early summer and a maximum in early winter. During last 16 years both summer
and winter concentrations were increasing, but with different rates. Positive summer trends over the Kara Sea and
over Atlantic control area were close one to another. In winter the Kara Sea methane was growing faster than over
Atlantic. The methane seasonal cycle amplitude tripled from 2003 to 2019. This phenomenon was considered in terms
of growing methane flux from the sea. This high trend was induced by a fast decay of the sea ice in this area with ice
concentrations dropped from 95 to 20%. If the current Arctic sea cover would decline further and open water area
would grow then further increase of methane concentration over the ocean may be foreseen.
Citation: Yurganov L.N. The relationship between methane transport to the atmosphere and the decay of the Kara Sea ice cover: satellite data for 2003-
2019. Led i Sneg. Ice and Snow. 2020. 60 (3): 423-430. doi: 10.31857/S2076673420030049.
Поступила 3 февраля 2020 г. / После доработки 12 апреля 2020 г. / Принята к печати 7 июня 2020 г.
Ключевые слова: климат Арктики, метан, морской лед, парниковые газы, спутниковые данные.
Проанализированы ИК спутниковые данные о концентрации метана в слое атмосферы 0-4 км над
Карским и Баренцевым морями в сравнении с микроволновыми спутниковыми измерениями ледя-
ного покрова Карского моря. За последние 16 лет амплитуда сезонных вариаций метана над север-
ной частью Карского моря выросла в 3 раза, а площадь поверхности того же района, свободная от
льда, увеличилась в 4 раза. Сделан вывод о значительной роли ледяного покрова в экранировании
потока метана в атмосферу.
Introduction
dioxide (CO2) over a 100-year time horizon [4]. The
Barents and Kara seas (BKS) have extensive proven re
The Arctic has experienced the fastest warm
serves of oil and natural gas [5]. Thermogenic methane
ing on the Earth over recent decades with the Arctic
seeps through sedimentary layers and forms hydrates at
Ocean warming at nearly double the rate of the world’s
and below the seafloor. A review article [3] describes the
oceans [1]. The area of ice cover, its thickness and con
principal processes that regulate methane distributions
centration have been significantly reduced [2]. There is
in the Arctic seafloor sediments, its fate in the water col
concern about release of huge reserves of climate-ac
umn, and subsequent release to the atmosphere. En
tive greenhouse gas methane (CH4) in hydrates, per
hanced dissolved methane concentrations in the seawa
mafrost and other reservoirs [3]. The radiation warm
ter are likely. They are related, at least in part, to melting
ing potential of methane is 28-34 times that of carbon
of gas hydrates and submerged permafrost. Methane is
423
Морские, речные и озёрные льды
slowly oxidized by methanotrophic bacteria in deep lay
They are especially helpful during the polar night, when
ers with time-scales of weeks or years [6]. As it was con
space-borne Short-wave IR sensors (e.g., TROPOMI,
cluded by [3], effects of reduced sea-ice cover on meth
that stands for TROPOspheric Monitoring Instrument)
ane emissions to air are especially poorly constrained.
are useless and ship measurements are very difficult lo
Satellite data presented here allow to fill this gap.
gistically. This paper analyzes methane concentrations
Warm Atlantic currents make the BKS a climati
in the lowest tropospheric layer over BKS delivered by
cally important region. A decline in BKS sea ice in
AIRS between 2003 and 2019 with a focus on Novem
early winter influences synoptic processes in the rest
ber-January period. These data were coupled with satel
of the Northern hemisphere [7]. The Barents Sea is
lite microwave measurements of ice concentration. This
a shallow sea (average depth 230 m) with depressions
area demonstrated the fastest decline in ice concentra
up to 400 m. The Kara Sea is even shallower (aver
tion for the entire Arctic Ocean in winter. The degra
age depth 100 m). One can expect release of methane
dation of ice and increasing methane flux look like the
from the seabed as a result of degradation of the sub
most obvious explanation of the methane seasonal am
marine permafrost [8] in the Kara and southern Bar
plitude increase during last 16 years. Moreover, this al
ents Seas. The Barents Sea is mostly free of ice year-
lows one to expect further growth of methane emission
round, while the Kara Sea winter ice cover underwent
from the Arctic Ocean, provided that the ice cover decay
dramatic decline during early winters in 2000s [9].
would proceed further.
Presence of sources is just one condition for meth
ane to enter the atmosphere; a transport of the gas from
the sea floor to the surface is equally important. The
Satellite data
relatively warm and salty layer of Atlantic water (pycno
cline) plays a role of a natural barrier for the penetration
The AIRS diffraction grating spectrometer was
of methane into the surface layer of the sea in summer/
launched in a sun-synchronous polar orbit in May 2002
early autumn between May and October [10]. Numer
on board the Aqua satellite [18]. The instrument scans
ous direct studies have shown that during this season
±48.3° from the nadir, which provides full daily cov
the flux in the Barents-Svalbard area is negligible [11-
erage in the Arctic. Spectral resolution is 1.5 cm-1 at
13]. These field investigations, however, discover strong
the methane ν4 absorption band near 7.65 μm. Cur
sources at the seabed and huge concentrations of dis
rently (April 2020), the AIRS is still operational. Start
solved methane in deep waters. The flux of methane
ing in September 2002, methane data were processed
may be significant only after a breakdown of the pycno
using a single version 6 of the standard algorithm de
cline in November and deepening of the Mixed Layer.
veloped by NASA [19]. Monthly average Level 3 meth
The Mixed Layer Depth (MLD) in the Arctic summer
ane, surface and air temperatures between October 2002
does not exceed 50 m. It increases sharply since No
and January 2020 are available on-line on a 1° × 1° lat
vember and, finally, the bulk of the Barents Sea water
column is mixed down by December [14]. Increased
gsfc.nasa.gov/datasets/. Methane profiles were ob
turbulent diffusion induces methane emission to the at
tained for a 3 × 3 matrix of 9 pixels with a diameter of
mosphere [15]. Methane over the Kara Sea was mea
13.5 km in nadir each. The profiles were averaged for
sured by IASI (Infrared Atmospheric Sounding Inter
the lower troposphere from the surface to the level of
ferometer) [16]. A significant increase of methane from
600 hPa (~4 km). An empirical sensitivity to methane
2010 to 2016 was found for late autumn/winter season
variations, 0.4-0.5, was based on comparison with si
in BKS. A further AIRS-based (Atmospheric InfraRed
multaneous aircraft measurements at three stations in
Sounder) study [17] reported large positive methane
the United States [15]. A physical meaning of the sen
anomalies around Franz Josef Land and offshore West
sitivity is a change in retrieved concentration that cor
Novaya Zemlya. Satisfactory explanations for signifi
responds to the unit change of the «true» value. E.g.,
cant positive trends in methane were not found.
the sensitivity 0.5 means that real variations are under
Ice cover, like the pycnocline, plays the role of a nat
estimated by 100%. The Thermal IR reliable measure
ural barrier to methane. A degradation of sea ice [3] may
ments require the surface to be warmer than air above
increase methane flux and its atmospheric concentra
it. The data were filtered for cases of Thermal Contrast
tion. Satellite observations in the thermal IR range are
ThC > 10 °C [20], where ThC = Tsurf - T600, Tsurf is sur
extremely useful for characterizing methane over sea.
face temperature, and T600 is air temperature at 600 hPa
424
L.N. Yurganov
air pressure. Grey color in Fig. 3, d corresponds to areas
The methane amplitudes in the Kara Sea grow with
with low ThC. So, vast areas of land and ice-covered
years, the amplitudes in a control Atlantic area also
ocean in winter can not be monitored using the current
grow, but much slower (see Table). In fact, in 2003 the
version of the processing technique.
amplitudes of the methane cycle in these two places
Sea ice concentration data are archived by the
were the same, but in 2018 the amplitudes of methane
NASA National Snow and Ice Data Center Distrib
in the Kara Sea were two to three times higher than in
the Atlantic. A positive amplitude trend in the Kara Sea
NSIDC-0081/versions/1). The mean monthly data
may be treated as a result of growing sea-air flux there
set [21] for 2003 - January 2019 is generated from the
due to a deсline of the sea ice cover. To test this hypoth
surface brightness temperature data and is designed to
esis, satellite data on ice concentration were used. Cir
provide a consistent time series of sea ice concentrations
cles in Fig. 1, c are mean fractions of open water Cwat for
the Box 1 (Kara Sea) for November-January in percent.
Cice (the fraction of ice for each 20 × 20 km2 pixel) span
ning the coverage of two passive microwave instruments
Open water area in Northern Kara Sea almost quadru
developed as a part of the Defense Meteorological Sat
pled in 16 years. Corresponding methane seasonal cycle
ellite Program (DMSP), DMSP-F8 and Special Sen
amplitude almost tripled. General trends are obvious,
sor Microwave Imager/Sounder (SSMIS) DMSP-F17.
but inter-annual variations of both methane and open
In our paper we use also the fraction of open water:
water in the Kara Sea are significant. It is natural to as
Cwat = 1 - Cice for comparison with methane concentra
sume that many other atmospheric and oceanic process
tions and their seasonal cycles.
es are involved in these variability: the correlation coef
ficient R for methane and the open water area variations
is not high (Fig. 2, see Table).
Results
This part of the Arctic Ocean in winter time is
unique in respect to the sea ice decline. This is illus
Methane in the mid-high Northern hemisphere has
trated by maps of mean open water fractions for peri
a maximum in winter and a minimum in summer. This
ods: November 2003 - January 2004 (Fig. 3, a) and for
cycle is driven mainly by seasonal changes in the tropo
November 2018 - January 2019 (see Fig. 3, b). Fig. 3, c
spheric photochemical sink, a reaction of methane with
is a simple difference between those two maps. Black
hydroxil OH [22]. Hydroxil concentration has a winter
continuous and dash lines correspond to ice edges, i.e.,
minimum and a summer maximum; its source is also
ice fraction (concentration) of 0.15. Fig. 3, d plots a dis
photochemical and requires ultraviolet solar radiation.
tribution of late autumn/winter methane increase dur
Variations of hydroxil concentration with years are usu
ing last 16 years. A background methane concentration
ally estimated as negligible or uncertain [23 and refer
change (e.g., in Northern Atlantic) in 16 years may be
ences therein]. Any changes of the methane seasonal
estimated as 40-50 ppb. One should not forget, how
cycle amplitude are supposed to be caused by chang
ever, about a reduced sensitivity of satellite data to the
es in its sea-air flux after the November breakdown of
lower troposphere, that tends to underestimate gas vari
the pycnocline [15]. Monthly mean low tropospheric
ation, see section «Satellite data» and [15]. Arctic meth
methane concentrations for 2003-2019 in the North
ane increase in 16 years may be as high as 80 ppb, i.e., a
ern Kara Sea (Box 1, Svyataya Anna Trough) are plotted
contribution of the Arctic sources may be estimated as
in Fig. 1, a. For comparison, a similar time series is pre
30-40 ppb. Both long-term data (see Fig. 1) and com
sented for a control box between Iceland and Scandina
parison of maps for 2003 and 2018 (see Fig. 3) are con
via (Box 2, see location of boxes on maps of Fig. 3), see
sistent with an idea of ice cover decline as a reason for
Fig. 1, b. Least-squares linear regression lines were cal
growing amplitude of the atmospheric methane concen
culated separately for November-January (designated
tration in northern parts of BKS.
in what follows as «winter») and for April-July («sum
mer»). The summer slopes are very close one to anoth
er, but the winter slope for the Kara Sea is significantly
Discussion
steeper. Amplitudes of the seasonal cycle (see Fig. 1, c)
were calculated as a difference between winter and pre
In our previous publication [15] IASI and AIRS
ceding summer averages. Parameters of regression for
methane data for the ice-free area to the South-West
these and other cases are listed in Table.
of Svalbard were analyzed. We found a good correla
425
Морские, речные и озёрные льды
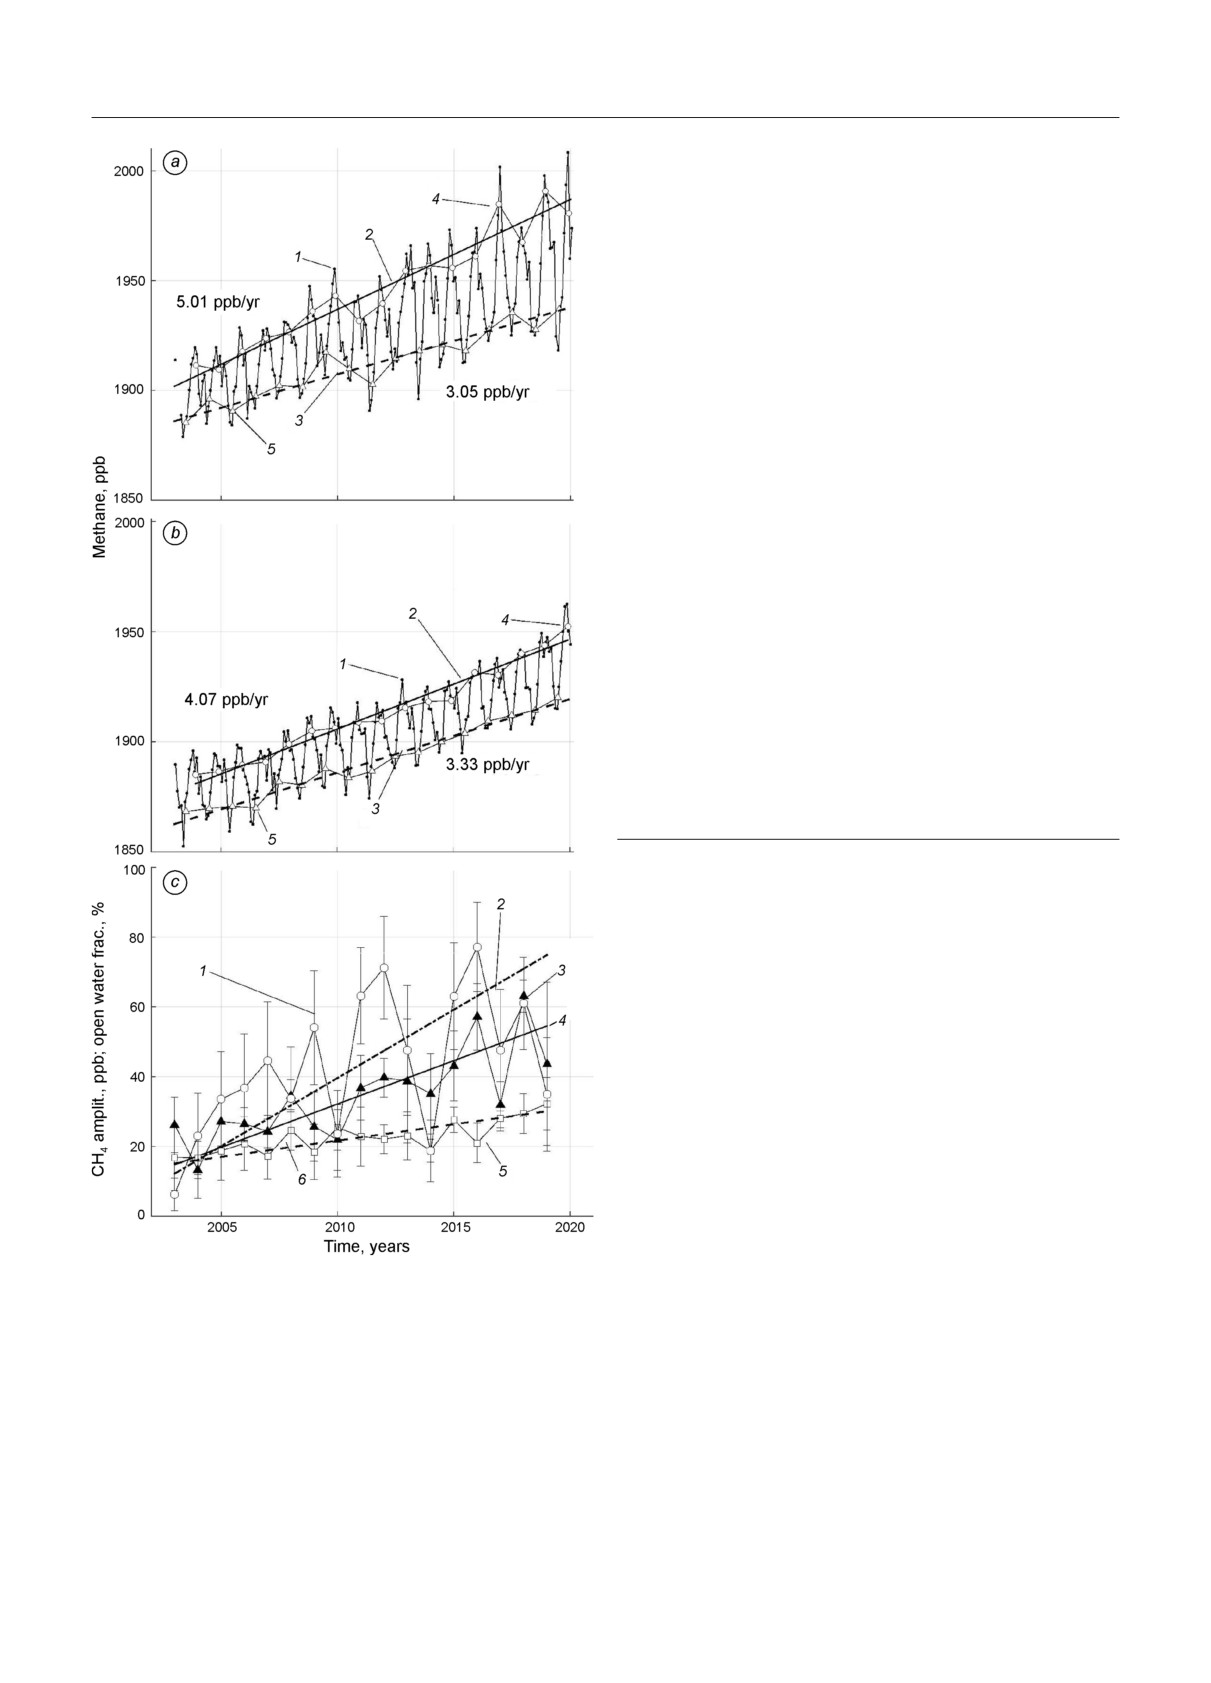
Fig. 1. Low troposphere (0-4 km of altitude) methane
concentrations in N. Kara Sea and a control Atlantic do
main. Ice-free fraction of the Kara Sea surface.
a - dots (1) are monthly mean methane for the Box 1 (Kara Sea).
Solid line (2) is linear regression for periods November to January
(winter). Dotted line (3) is linear regression for periods April to July
(summer). Open circles (4) and open triangles (5) are for winter and
summer seasonal averages, respectively. b - The same but for the
control Box 2 (Northern Atlantic). c - Circles (1) are for open water
fraction (Cwat = 1 - Cice) for Box 1. Line 2 is linear regression. 3 and
5- monthly mean amplitudes of seasonal cycles for Boxes 1 and 2,
respectively. 4 and 6 - regression lines for methane amplitude,
Boxes 1 and 2, respectively. Slopes are shown in Table
Рис. 1. Концентрации метана в нижней тропосфере
(0-4 км по высоте) над севером Карского моря и над
контрольным Атлантическим доменом. Относитель
ная площадь поверхности, свободной ото льда, Кар
ское море.
a - точки (1) - среднемесячные концентрации метана для
домена 1; (2) - линейная регрессия для периода с ноября
по январь (зима); (3) - линейная регрессия для периода с
апреля по июль (лето); пустые кружки (4) и треугольни
ки (5) для зимы и для лета соответственно. b - то же, но
для контрольного домена 2 (Cеверная Атлантика). c - (1) -
относительная площадь открытой воды (Cwat = 1 - Cice) для
домена 1 в процентах, Карское море; (2) - линейная ре
грессия; (3) и (5) - среднемесячные амплитуды сезонного
цикла для доменов 1 и 2 соответственно; (4) и (6) - линии
регрессии для доменов 1 и 2 соответственно. Наклоны
линий регрессии приведены в таблице
that paper. Such analysis is conducted in the present
study in regard to ice degradation in the Kara Sea.
We found that during last 16 years a maximal trend of
methane amplitude was observed over partially ice-
covered Kara Sea (see Fig. 1-3 and see Table).
Mean autumn-winter ice concentration in the
Northern Kara Sea (Box 1) diminished from ~95%
in November 2003 - January 2004 to only ~20% in
November 2016 - January 2017. This degradation of
the ice cover significantly facilitated methane flux to
air: the amplitude of the methane seasonal cycle for
Box 1 increased from ~20 ppb to ~60 ppb. In fact,
quadrupling open water area resulted in tripling meth
ane cycle amplitude. During «normal» Kara Sea con
ditions, prevailed before early 2000s, most of methane
emitted from the seafloor was oxidized by methano
tion between a seasonal course of methane month
trophic bacteria under the sea ice. Ice cover played
ly anomalies averaged over 2014-2016 and monthly
the role of a lid that let bacteria to consume dissolved
MLD: after late October both methane and MLD
methane. Presently the situation is changing. The ice
increased. We connected this fact with the destruc
cover is declining, open water area is growing, the dif
tion of pycnocline in early November and increased
fusion easily moves methane through the seawater col
turbulent diffusion. The water mixing is blocked
umn and numerous leads into the atmosphere. The
by highly stratified seawater in summer. Changes
diffusion seems to be faster than the bacterial oxida
in methane flux with years were not considered in
tion that has timescales of weeks to months [6]. In a
426
L.N. Yurganov
Statistical parameters of linear regressions*
Статистические параметры линейной регрессии*
Line
Data and Box
Slope
Intercept
LCB
UCB
Corr. coeff.
1
Methane winter vs time, Box 1
5.01
-8129.61
4.3
5.72
0.93
2
Methane summer vs time, Box 1
3.05
-4220.35
2.53
3.57
0.90
3
Methane amplitude vs time, Box 1
2.49
-4967.72
1.63
3.34
0.60
4
Methane amplitude vs open water, Box 1
0.64
6.99
0.37
0.90
0.41
5
Methane winter, vs time Box 2
4.07
-6279.24
3.7
4.44
0.97
6
Methane summer vs time, Box 2
3.33
-4812.04
3.03
3.64
0.97
7
Open water vs time, Box 1
3.91
-7833.56
2.11
5.74
0.28
*LCB and UCB are lower and upper confidence bounds for slope at 95% confidence, calculated according to [29]. Units: lines 1-6, ppb/year
or ppb. Line 7, percent/year or percent.
*LCB и UCB - нижняя и верхняя границы доверительного интервала для наклона [29]. Единицы измерения: строки 1- 6,
ppb/год или ppb: cтрока 7 - процент/год или процент.
in November, 2009, to the North of Bering Strait (2
circles in Fig. 3) showed a clear signature of meth
ane flux from sea surface through leads. A discussion
of the nature of methane sources is beyond the scope
of this study; we discussed the role of modern changes
in flooded permafrost and the seepage of thermogenic
methane elsewhere [28].
Conclusions
1. We found that the amplitude of the methane
seasonal cycle in the Northern Kara Sea tripled dur
ing the last 16-years period. The Kara Sea ice cover
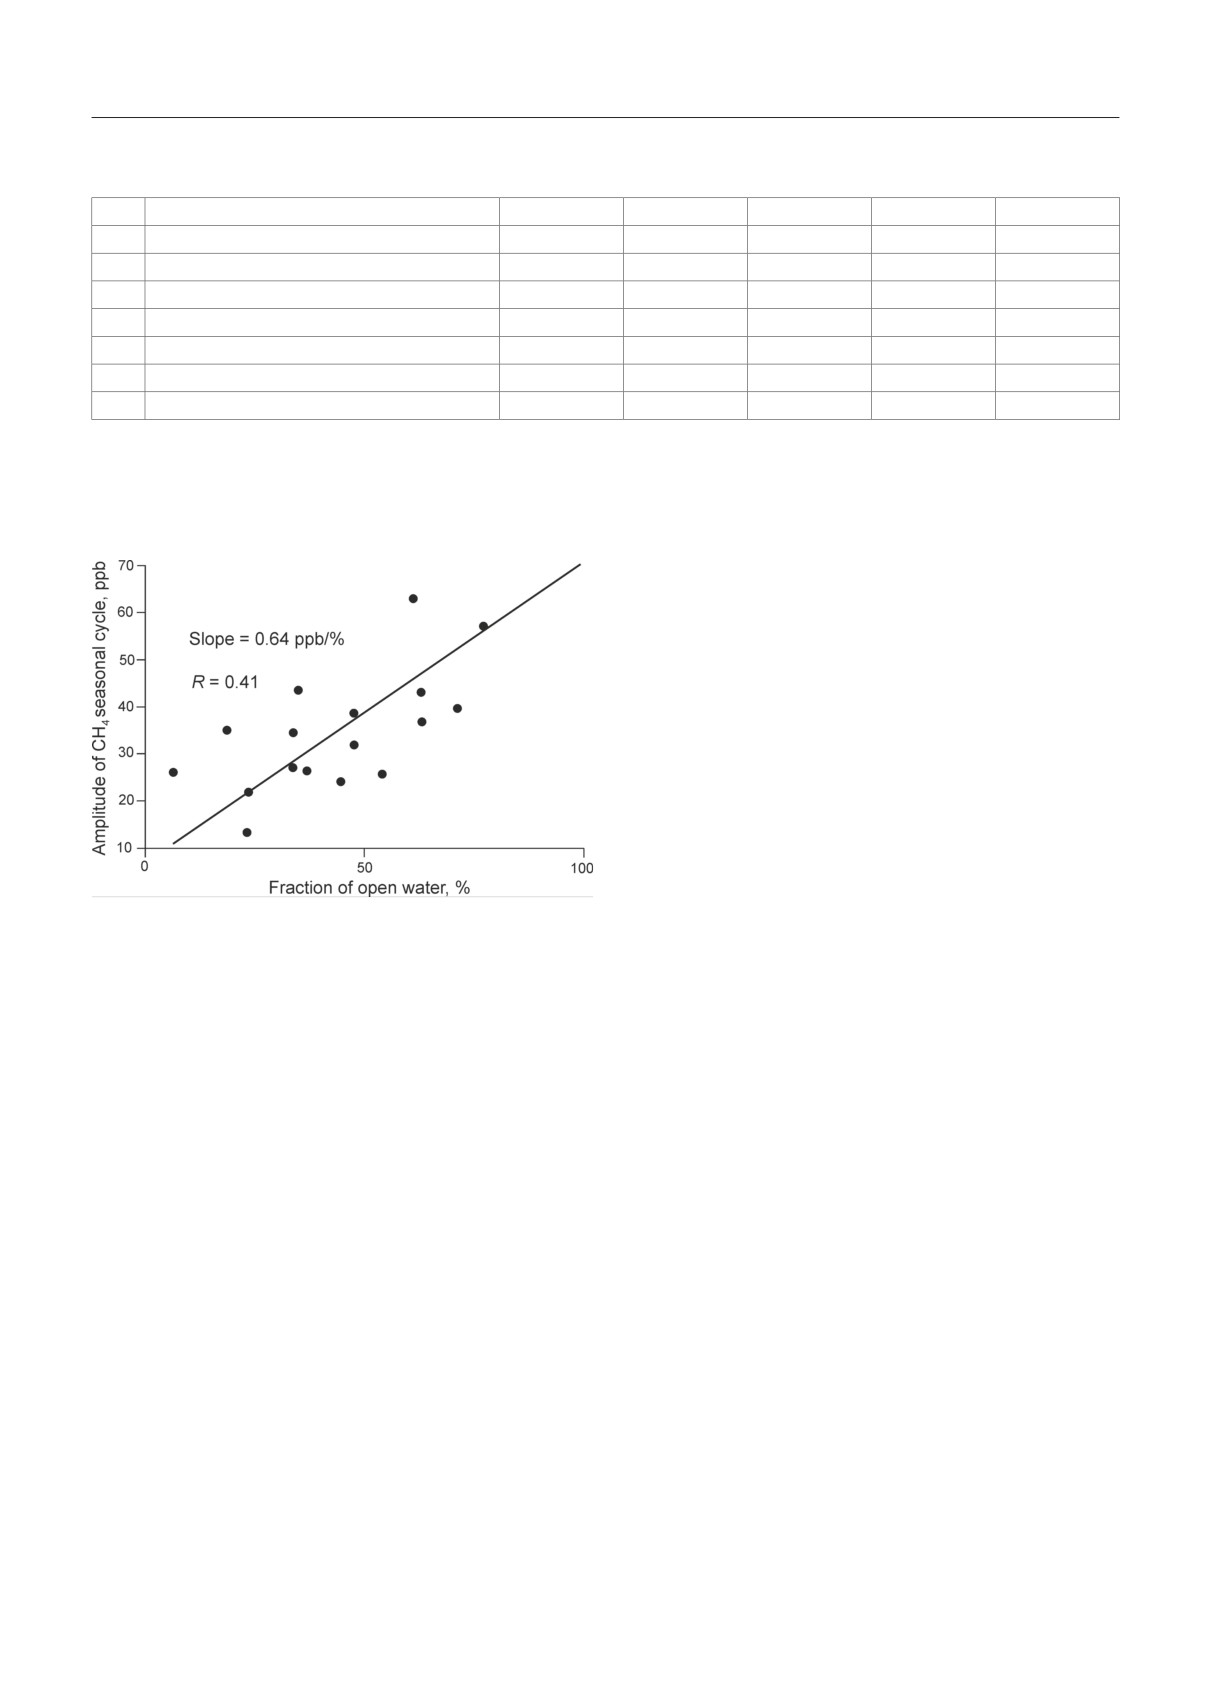
Fig. 2. Scattergram of methane cycle amplitude versus
fraction of open water for Box 1 for 2003-2018
in the autumn-winter periods underwent crucial
Рис. 2. Зависимость амплитуды сезонного цикла ме changes between 2003 and 2019: mean ice concen
тана от относительной площади открытой воды для tration diminished from 95% (2003/04 winter sea
домена 1, 2003-2018 гг.
son) to 20% (2016/17 winter season) and open water
area in November-January quadrupled. Ice cover
longer perspective, the sea ice may decline further and
plays a role of a barrier for methane. Its decline in
the winter ice degradation would expand to other Arc
duces increase of the methane flux.
tic seas. A further increase of methane flux from the
2. If the ice cover decay would proceed further, a
Arctic Ocean surface may be expected. Satellite moni
growth of methane flux from the rest of the Arctic in
toring is important for elucidation of different factors
late autumn/winter season is expected. In this regard
influencing the methane cycle and trends.
our preliminary estimate of the Arctic Ocean meth
A significant methane flux to atmosphere was re
ane contribution for 2010-2014 as ~2/3 of that from
ported for East Siberian Arctic Shelf seas [24], though
land [20] may be re-evaluated.
later studies downplayed those high estimates, con
3. It's reasonable to assume that presently and in
clusions, and predictions [25, 26]. Unfortunately, re
the near future ice cover decline would play a lead
liable satellite data for this part of the Arctic in winter
ing role for the methane trends in the Arctic, more
time are missing (grey areas on the map of Fig. 3, d).
important than deep seawater temperature chang
However, the influx of Pacific warm waters into the
es. Growing methane in conjunction with warming
Chukchi Sea through the Bering Strait makes winter
seawater surface may induce positive feed-back link
satellite measurements possible there too, but this area
during winter with significant climatic consequences
needs special consideration. Aircraft observations [27]
for populated mid-latitudes [7].
427
Морские, речные и озёрные льды
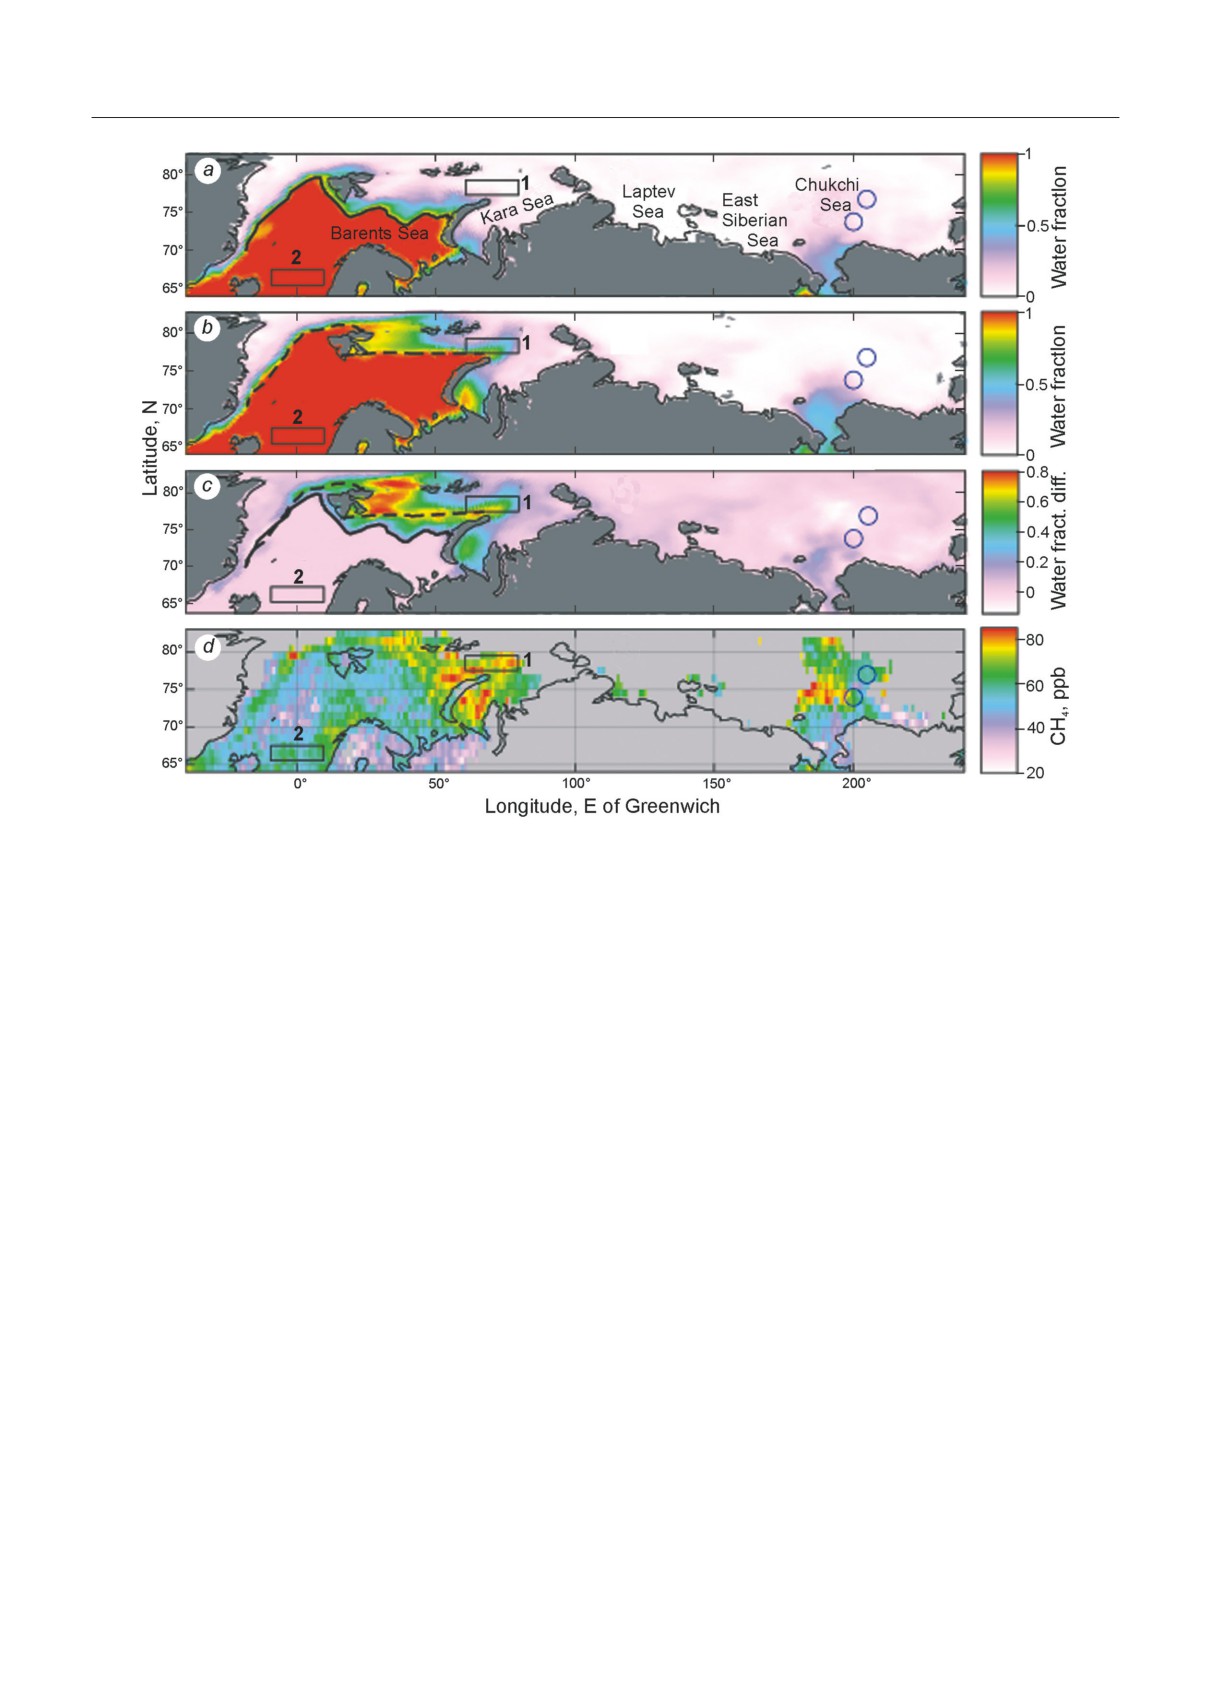
Fig. 3. Open water fraction Cwat and methane concentration change for the Russian Arctic shelf.
a - Cwat for November 2003 - January 2004; b - Cwat for November 2018 - January 2019; c - difference in water fraction be
tween (b) and (a). The solid and dashed lines indicate the edge of the ice (ice concentration 15%). d - difference in low tropospher
ic methane concentration between winters of 2018/19 and 2003/04. Average depths for Boxes: 1 - 313 m; 2 - 2100 m
Рис. 3. Относительная площадь открытой воды Cwat и изменение концентрации метана для морей арктиче
ского шельфа России.
a - Cwat с ноября 2003 по январь 2004 г.; b - Cwat с ноября 2018 по январь 2019 г.; c - разница в относительной площади
открытой воды между зимами 2003/04 г. и 2018/19 г., сплошная и штриховая линии обозначают кромку льда (концентра
ция льда 15%); d - разница концентраций метана в нижней тропосфере между зимами 2018/19 г. и 2003/04 г. Средние
глубины для доменов: 1 - 313 м; 2 - 2100 м
Расширенный реферат
ния. Измерения атмосферного метана над Север
ным Ледовитым океаном проводятся на судах и в
Метан (СН4) - парниковый газ, второй по зна
процессе эпизодических самолётных эксперимен
чению для глобального потепления после диок
тов. Сложные климатические условия не позволя
сида углерода (СО2). Примерно половина источ
ют вести такие работы в зимнее время. Спутники,
ников метана в атмосфере имеет антропогенную
запущенные на полярные солнечно-синхронные
природу и находится на континенте. Между тем,
геоцентрические орбиты, дают возможность изме
под шельфом Северного Ледовитого океана скры
рять газовый состав атмосферы, причём покрытие
ты огромные запасы этого газа, который может
поверхности Арктики существенно лучше, чем в
выделяться в атмосферу по мере потепления Ар
тропиках. Спектрометры, использующие солнеч
ктики. Метан просачивается из месторождений
ный свет (например, TROPOMI) по известным
углеводородов, поступает из субаквальной мерзло
причинам в Арктике неэффективны, особенно во
ты и из метаногидратов. В результате парникового
время полярной ночи. Для приборов, работающих
эффекта может возникнуть положительная обрат
на собственном ИК-излучении Земли и атмосфе
ная связь, которая приведёт к ускорению потепле
ры, таких ограничений не существует.
428
L.N. Yurganov
В статье приведены данные об атмосфер
Концентрации метана в период 2003-2019 гг.
ном метане над Северным Ледовитым океаном,
для севера Карского моря (жёлоб Святой Анны,
полученные ИК-спектрометром AIRS в послед
домен 1 на рис. 3) и для контрольного района
ние 16-17 лет. Исходные данные, обработанные
между Исландией и Скандинавией (домен 2) при
НАСА, потребовали добавочной фильтрации для
ведены на рис. 1, a и b. Сплошные линии пока
выделения случаев достаточно тёплой поверх
зывают тренды изменения метана для сезонных
ности: разница между температурами поверхности
максимумов и минимумов. Амплитуды сезонных
и воздуха на высоте 4 км должна быть не менее
вариаций для двух доменов нанесены в зависи
10 °С. Концентрации, усреднённые по слою 0-4 км
мости от времени на рис 1, c. Амплитуда сезон
высоты, были валидированы с помощью система
ного хода метана над Карским морем существен
тических самолётных измерений на трёх станци
но растёт с годами. Район Карского моря в начале
ях НОАА в США. Чувствительность к изменениям
зимы уникален для всего Северного Ледовитого
концентрации метана в нижней тропосфере оце
океана с точки зрения тренда разрушения ледя
нена в диапазоне 0,4-0,5 (отношение измеренной
ного покрова: кружки на рис. 1, с соответствуют
вариации метана к реальной). Кроме метана, ис
процентной доле площади открытой воды в до
пользованы данные микроволновых спутниковых
мене 1. За 16 лет она возросла в 4 раза. Такой рост
измерений концентрации льда (доли площади льда
является рекордным для морей Северного Ледо
в пикселе 20 × 20 км2). Доля чистой воды в домене
витого океана (рис. 3, a - c). Рис. 3, d показывает
сопоставлялась с вариациями концентрации мета
пространственное распределение аномалий ме
на. Потоки метана в атмосферу зависят от наличия
тана - разницу в концентрации между зимними
источников метана на дне моря, в осадочных по
сезонами 2003/04 и 2018/19 гг. Максимумы на
родах и/или в субаквальной мерзлоте. Второе усло
блюдаются в Карском море, на северо-востоке Ба
вие для существования значительного потока газа
ренцева моря и на севере Чукотского моря. Серый
в атмосферу - его перенос от глубоководных слоёв
цвет говорит об отсутствии надёжных данных. Ре
к поверхности. Летом существует естественный ба
зультаты спутникового зондирования подтверж
рьер для вертикального перемешивания водных
дают предположение, что ледяной покров суще
масс - пикноклин, представляющий собой рез
ственно блокировал поток метана от Карского
кий скачок плотности воды на глубине ниже пере
моря в ноябре-январе в начале 2000-х годов, а его
мешенного слоя. Поток метана усиливается после
разрушение в последующие годы привело к росту
разрушения пикноклина в ноябре. Но если поверх
амплитуды сезонного хода этого газа. Высказано
ность воды в ноябре-декабре покрыта сплошным
мнение, что по крайней мере в ближайшем буду
льдом, как это было до 2003 г. в Карском море, то
щем рост потока метана от Северного Ледовито
его поток в атмосферу остаётся минимальным. Рас
го океана будет в большей степени определяться
творённый избыточный метан в течение зимы и
процессом изменения ледяного покрова Арктики,
лета окисляется бактериями.
чем изменениями температуры в глубине моря.
References
4. Myhre G., Shindell D., Bréon F.-M., Collins W., Fuglest-
vedt J., Huang J., Koch D. Lamarque J.-F., Lee D., Men-
1. Hoegh-Guldberg O., Bruno J.F. The impact of climate
doza B., Nakajima T., Robock A., Stephens G., Takemura T.,
change on the world’s marine ecosystems. Science.
Zhang H. Anthropogenic and natural radiative forcing. Cli
2010, 328: 1523-1528. doi: 10.1126/science.1189930
mate Change 2013: The Physical Science Basis, Fifth As
2. Comiso J.C., Parkinson C. L., Gersten R., Stock L. Ac
sessment Report of the Intergovernmental Panel on Cli
celerated decline in the Arctic sea ice cover. Geo
mate Change. Eds.: Stocker T.F., Qin D., Plattner G.-K.,
phys. Research Letters. 2008, 35: L01703. doi:
Tignor M., Allen S.K., Boschung J., Nauels A., Xia Y.,
10.1029/2007GL031972.
Bex V., Midgley P.M. Cambridge University Press, Cam
3. James R.H., Bousquet P., Bussmann I., Haeckel M., Kip-
bridge, UK, New York, NY, USA, 2013: 659-740.
fer R., Leifer I., Niemann H., Ostrovsky I., Piskozub J.,
5. Shipilov E.V., Murzin R.R. Hydrocarbon deposits of western
Rehder G., Treude T., Vielstadte L., Greinert J. Ef
part of Russian shelf of Arctic—Geology and systematic
fects of Climate Change on Methane Emissions from
variations. Petrol. Geol. 2002, 36 (4): 325-347. [Translat
Seafloor Sediments in the Arctic Ocean: A Review.
ed from Геология нефти и газа. 2001, 4: 6-19.]
6. Reeburgh W.S. Oceanic methane biogeochemistry. Chemi
org/10.1002/lno.10307.
cal Reviews. 2007, 107: 486-513. doi: 10.1021/cr050362v.
429
Морские, речные и озёрные льды
7. Petoukhov V., Semenov V.A. A link between reduced Bar
Sounder (AIRS). Journ. of Geophys. Research. 2008,
ents Kara sea ice and cold winter extremes over north
113: G00A01. doi: 10.1029/2007JG000500.
ern continents. Journ. of Geophys. Research. 2010,
19. Susskind J., Blaisdell J.M., Iredell L. Improved method
115: D21111. doi: 10.1029/2009JD013568.
ology for surface and atmospheric soundings, error esti
8. Portnov A., Mienert J., Serov P. Modeling the evolu
mates, and quality control procedures: the atmospheric
tion of climate sensitive Arctic subsea permafrost in re
infrared sounder science team version-6 retrieval algo
gions of extensive gas expulsion at the West Yamal shelf.
rithm. Journ. of Applied Remote Sensing. 2014, 8 (1):
Journ. of Geophys. Research. Biogeosciences. 2014, 119
20. Yurganov L., Leifer I., Lund-Myhre C. Seasonal and
9. Zhang Q., Xiao C., Ding M., Dou T. Reconstruction of
interannual variability of atmospheric methane over
autumn sea ice extent changes since AD1289 in the Bar
Arctic Ocean from satellite data. Current Problems in
ents-Kara Sea, Arctic. China Earth Science. 2018, 61:
Remote Sensing of Earth from Space. 2016, 13: 107-
119. doi: 10.21046/2070-7401-2016-13-2-107-119.
10. Rudels B. High latitude ocean convection. In: Flow
21. Cavalieri D.J., Parkinson C.L., Gloersen P., Zwally H.J.
and Creep in the Solar System: Observations, Model
Sea Ice Concentrations from Nimbus-7 SMMR and
ling and Theory. Eds.: D.B. Stone and S.K. Runcorn.
DMSP SSM/I-SSMIS Passive Microwave Data, Ver
Academic Publishers, Dordrecht., 1993: 323-356.
sion 1. Boulder, Colorado USA. NASA National Snow
11. Gentz T., Damm E., von Deimling J.S., Mau S., McGin-
and Ice Data Center Distributed Active Archive Center,
nis D.F., Schlüter M. A water column study of methane
around gas flares located at the West Spitsbergen con
22. Holmes C.D., Prather M.J., Søvde O.A., Myhre G. Fu
tinental margin. Continental Shelf Research. 2014, 72:
ture methane, hydroxil, and their uncertainties: key
107-18 . doi: 10.1016/j.csr.2013.07.013.
climate and emission parameters for future predic
12. Myhre C.L., Ferré B., Platt S.M., Silyakova A., Her-
tions. Atmospheric Chemistry and Physics. 2013, 13:
mansen O., Allen G., Pisso I., Schmidbauer N., Stohl A.,
Pitt J., Jansson P., Greinert J., Percival A.C., Fjaeraa M.,
23. Stevenson D.S., Zhao A., Naik V., O'Connor F.M., Tilmes S.,
O'Shea S.J., Gallagher M., Le Breton M., Bower K., N.
Zeng G., Murray L.T., Collins W.J., Griffiths P., Shim S.,
Bauguitte S., J.B. Dalsøren S., Vadakkepuliyambatta S.,
Horowitz L.W., Sentman L., Emmons L. Trends in global tro
Fisher R.E., Nisbet E.G., Lowry D., Myhre G., Pyle J.A.,
pospheric hydroxyl radical and methane lifetime since 1850
Cain M., Mienert J. Extensive release of methane from
from AerChemMIP. Atmospheric Chemistry and Physics.
Arctic seabed west of Svalbard during summer 2014 does
not influence the atmosphere. Geophys. Research Let
24. Shakhova N., Semiletov I., Leifer I., Sergienko V., Salyuk A.,
ters. 2016, 43: 4624-4631. doi: 10.1002/2016GL068999.
Kosmach D., Chernikh D., Stubbs Ch., Nicolsky D., Tums-
13. Mau S., Romer M., Torres M.E., Bussmann I., Pape T.,
koy V., Gustafsson O. Ebullition and storm-induced methane
Damm E., Geprags P., Wintersteller P., Hsu C.W.,
release from the East Siberian Arctic Shelf. National Geo
Loher M., Bohrman G. Widespread Methane Seep
age along the Continental Margin off Svalbard-From
25. Miller C.M., Dickens G.R., Jakobsson M., Johansson C.,
Bjornoya to Kongsfjorden. Sci. Rep. 2017, 7: 42997:1-
Koshurnikov A., O’Regan M., Muschitiello F., Stranne C.,
and Mörth C.-M. Pore water geochemistry along continen
14. Kara A.B, Rochford P.A, Hurlburt H.E. Mixed layer depth
tal slopes north of the East Siberian Sea: inference of low
variability over the global Ocean. Journ. of Geophys.
methane concentrations. Biogeosciences. 2017, 14 (12):
Research. 2002, 108 (C3). doi: 10.1029/2000JC000736.
15. Yurganov L., Muller-Karger F., Leifer I. Methane increase
26. Thornton B.F., Prytherch J., Andersson K., Brooks I.M.,
over the Barents and Kara Seas after the autumn pycno
Salisbury D., Tjernstrom M., Crill P.M. Shipborne eddy
cline breakdown: satellite observations. Adv. Polar Sci.
covariance observations of methane fluxes constrain
2019, 30 (4): 382-390. doi: 10.13679/j.advps.2019.0024.
Arctic sea emissions. Science Advances. 2020, 6 (5):
16. Yurganov L.N., Leifer I., Vadakkepuliyambatta S. Evi
eaay7934. doi: 10.1126/sciadv.aay7934.
dences of accelerating the increase in the concentration
27. Kort E.A., Wofsy S.C., Daube B.C., Diao M., El-
of methane in the atmosphere after 2014: satellite data
kins J.W., Gao R.S., Hintsa E.J., Hurst D.F., Jimenez R.,
for the Arctic, Current problems in remote sensing of
Moore F.L., Spackman J.R., Zondlo M.A. Atmospheric
the Earth from space, 14 (5): 248-258. doi: 10.13140/
observations of Arctic Ocean methane emissions up
RG.2.2.16613.29927.
to 82° north. National Geosciences. 2012, 5: 318-321.
17. Leifer I., Chen F.R., McClimans T., Muller Karger F.,
Yurganov L. Satellite ice extent, sea surface temper
28. Anisimov O.A., Zaboikina Y.G., Kokorev V.A., Yurganov L.N.
ature, and atmospheric methane trends in the Bar
Possible causes of methane release from the East Arctic seas
ents and Kara Seas. The Cryosphere. Discussion. 2018.
shelf. Led i Sneg. Ice and Snow. 2014, 54 (2): 69-81. https://
doi.org/10.15356/2076-6734-2014-2-69-81. [In Russian].
18. Xiong X., Barnet C., Maddy E., Sweeney C., Liu X.,
29. Chatterjee S., Hadi A.S. Influential observations, high
Zhou L., Goldberg M. Characterization and validation
leverage points, and outliers in linear regression. Sta
of methane products from the Atmospheric Infrared
tistic Sciences. 1986, 1: 379-416.
430