ЖЭТФ, 2022, том 161, вып. 4, стр. 583-589
© 2022
DETECTABILITY OF LARGE CORRELATION
LENGTH INFLATIONARY MAGNETIC FIELD
WITH CHERENKOV TELESCOPES
A. Korochkina,b,c, A. Neronova,d, G. Lavauxe, M. Ramsøya,e, D. Semikoza,b,f*
a Université de Paris, CNRS, Astroparticule et Cosmologie
F-75006, Paris, France
b Institute for Nuclear Research of the Russian Academy of Sciences
117312, Moscow, Russia
c Novosibirsk State University
630090, Novosibirsk, Russia
d Laboratory of Astrophysics, Ecole Polytechnique Federale de Lausanne
1015, Lausanne, Switzerland
e Institut d’Astrophysique de Paris (IAP), CNRS & Sorbonne Université
F-75014, Paris, France
f National Research Nuclear University MEPHI (Moscow Engineering Physics Institute)
115409, Moscow, Russia
Received November 9, 2021,
revised version November 19, 2021
Accepted for publication November 19, 2021
Contribution for the JETP special issue in honor of A. E. Chudakov’s 100th anniversary
DOI: 10.31857/S0044451022040125
ble for the generation of a relic magnetic field. First
EDN: DQQDYL
order phase transitions that might have happened at
quark confinement or during the Electroweak epoch can
Observations of extended and delayed gamma-ray
produce short correlation length magnetic field that
emission around extragalactic sources of TeV γ-rays
evolves through turbulent decay toward a magnetic
provides a possibility of measurement of magnetic field
field configuration with correlation length and strength
in the voids of the Large Scale Structure (LSS) [1-3].
satisfying a relation λB ∼ 0.1[B/10-12 G] kpc today
This emission is generated by electron-positron pairs
[9, 10]. Alternatively, a field generated at the epoch of
deposited by the pair production by γ-rays on the Ext-
inflation can have a very large correlation length, up to
ragalactic Background Light. The combination of data
the present day Hubble scale [11-19].
from current generation Cherenkov telescopes, HESS,
MAGIC, and VERITAS with data from the Fermi-LAT
Magnetic fields from galactic outflows, if they effi-
telescope currently constrains the void field strength to
ciently pollute the voids (as suggested e. g. by Bertone
be stronger than ∼ 10-17 G [4-6]. The next-generation
et al. [20]), would be distinguishable from both in-
Cherenkov Telescope Array (CTA) will provide a pos-
flationary and phase transition field based on their
sibility to explore the magnetic field over a wide range
galaxy scale correlation length (10-100 kpc). This
of possible strength and correlation lengths, up to the
is much larger than that of the phase transition in-
field strength of the order of B ∼ 10-11 G [7, 8].
duced field, but not reaching the Hubble scale of the
Several physical phenomena that took place a frac-
correlation length of the inflationary field. However
tion of a second after the Big Bang can be responsi-
even though magnetised outflows from galaxies can
spread non-cosmological magnetic fields in the inter-
* E-mail: semikoz@gmail.com
galactic medium, these outflows are most likely not
583
A. Korochkin, A. Neronov, G. Lavaux et al.
ЖЭТФ, том 161, вып. 4, 2022
strong enough to fill the voids [21, 22]. This suggests
gical voids where the impact of processes are likely to be
that the volume-filling magnetic field in the voids is a
small [22,31]. As a result of this the magnetic field is a
relic from the Early Universe [19].
smoothed tracer of the dark matter density field. Only
In what follows we explore the possibility of dis-
sufficiently massive objects are capable of producing
tinguishing between these two possibilities observation-
large enhancements of the gas density field. Regions
ally. Large correlation length fields break isotropy by
with overdensities greater than approximately 3 were
selecting a unique direction in a cosmologically large
thought to be close enough to structures that generate
volume. This selected direction imposes a correlated
magnetized outflows that they are at risk of being “pol-
asymmetry on magnetic field dependent extended emis-
luted” by magnetic fields of non-cosmological origin, as
sion patterns around γ-ray sources across the sky. We
indicated in [21]. The magnetic field strength in such
explore if it is possible to detect this asymmetry and
regions may deviate from simple scaling imposed by the
measure the inflationary magnetic field direction. We
amplification due to pure adiabatic contraction. As a
use a magnetic field generated from a realistic model of
result we therefore mark as high magnetic field region
the LSS derived from Borg constrained cosmological
any area with an overdensity greater than 3 averaged
simulations [23] that reproduces the location of known
over a thin cylinder with radius 2.7 Mpc (3 cells in the
LSS elements (galaxies, clusters) in the local Universe.
zoom region) along the line of sight during the course
Our analysis relies on magneto-hydrodynamic (MHD)
of our analysis.
simulations using the Ramses code [24] to estimate
Ramses-MHD was used due to its implementation
the effect of the structure formation on the initial mag-
of a constrained transport scheme [32]. Potentially spu-
netic field configuration. Modelling the properties of
rious amplification of the magnetic field seen in codes
secondary γ-ray signal is performed with the CRbeam
that use divergence cleaning schemes (e. g. [33,34]) are
code [25]. We use calculations of electromagnetic cas-
suppressed by this scheme. In any case, this effect is
cades along lines of sight to known nearby blazars to
most important in high density regions such as the cen-
estimate the influence of large correlation length mag-
tres of clusters and should have a minimal effect in this
netic field on the properties of secondary γ-ray signal
work.
from the cascade.
There are several known TeV blazars whose posi-
We calculate intergalactic magnetic field (IGMF)
tion falls within the high resolution simulation volume,
out to a distance of 200 Mpc from the Milky Way
Mkn 421, Mkn 501, QSO B2344+514, Mkn 180, 1ES
by running MHD simulations using the Ramses-MHD
1959+650, AP Librae and TXS 0210+515. All the
code [26] on the initial conditions (ICs) from Borg
sources are well-established TeV emitters. The prox-
[27]. Using a Markov Chain Monte Carlo approach,
imity of the sources enables measurements of their in-
the Borg methodology generates ICs that are con-
trinsic spectra attenuated by the pair production effect
strained to reproduce the structure of positions of real
up to 10 TeV. This is important because the extended
galaxies and galaxy clusters of the 2M++ survey [28]
emission in the energy range above 100 GeV is produced
within 200 Mpc cube around Milky Way. A cosmologi-
by electrons and positrons injected in interactions of
cal zoom of one variant of the Borg ICs was produced
γ-rays with energies above 10 TeV. Measurement of
using Music algorithm [29] to generate a high resolu-
the flux above 10 TeV allows us to obtain reliable es-
tion region 200 Mpc around the Milky Way with spatial
timates of the expected power of the secondary flux in
resolution at z = 0 of 0.7 h-1 · Mpc and mass resolu-
the E > 100 GeV range.
tion 2.1 · 1010 h-1 · M⊙. This is a factor 4 increase over
The lines of sight toward 7 sources are oriented at
the original Borg ICs spatial resolution. Note however
different angles with respect to the direction of initial
that the density fluctuations on this scale are uncon-
homogeneous field chosen in simulation. This provides
strained. The initial configuration of the magnetic field
a possibility to study how variations of the misalign-
is uniform across the simulation volume with strength
ment of the cosmological field direction affects the ob-
up to 10-12 G. Its direction is chosen to be in the di-
servational appearance of the extended emission. Lines
rection of north (Dec = 90◦) of the ICRS coordinate
of sight toward two sources, 1ES 1959+650 and Mkn
system. The hydrodynamical variables and magnetic
180 are more strongly aligned to the direction of the
field were evolved on the AMR grid using the HLLD
magnetic field than, say, the lines of sight to Mkn 421
solver [30] with the MinMod slope limiter being used
and Mkn 501. The line of sight toward AP Librae has
to reconstruct variables at cell interfaces.
the largest misalignment angle in our sample.
The simulation was run without cooling, star forma-
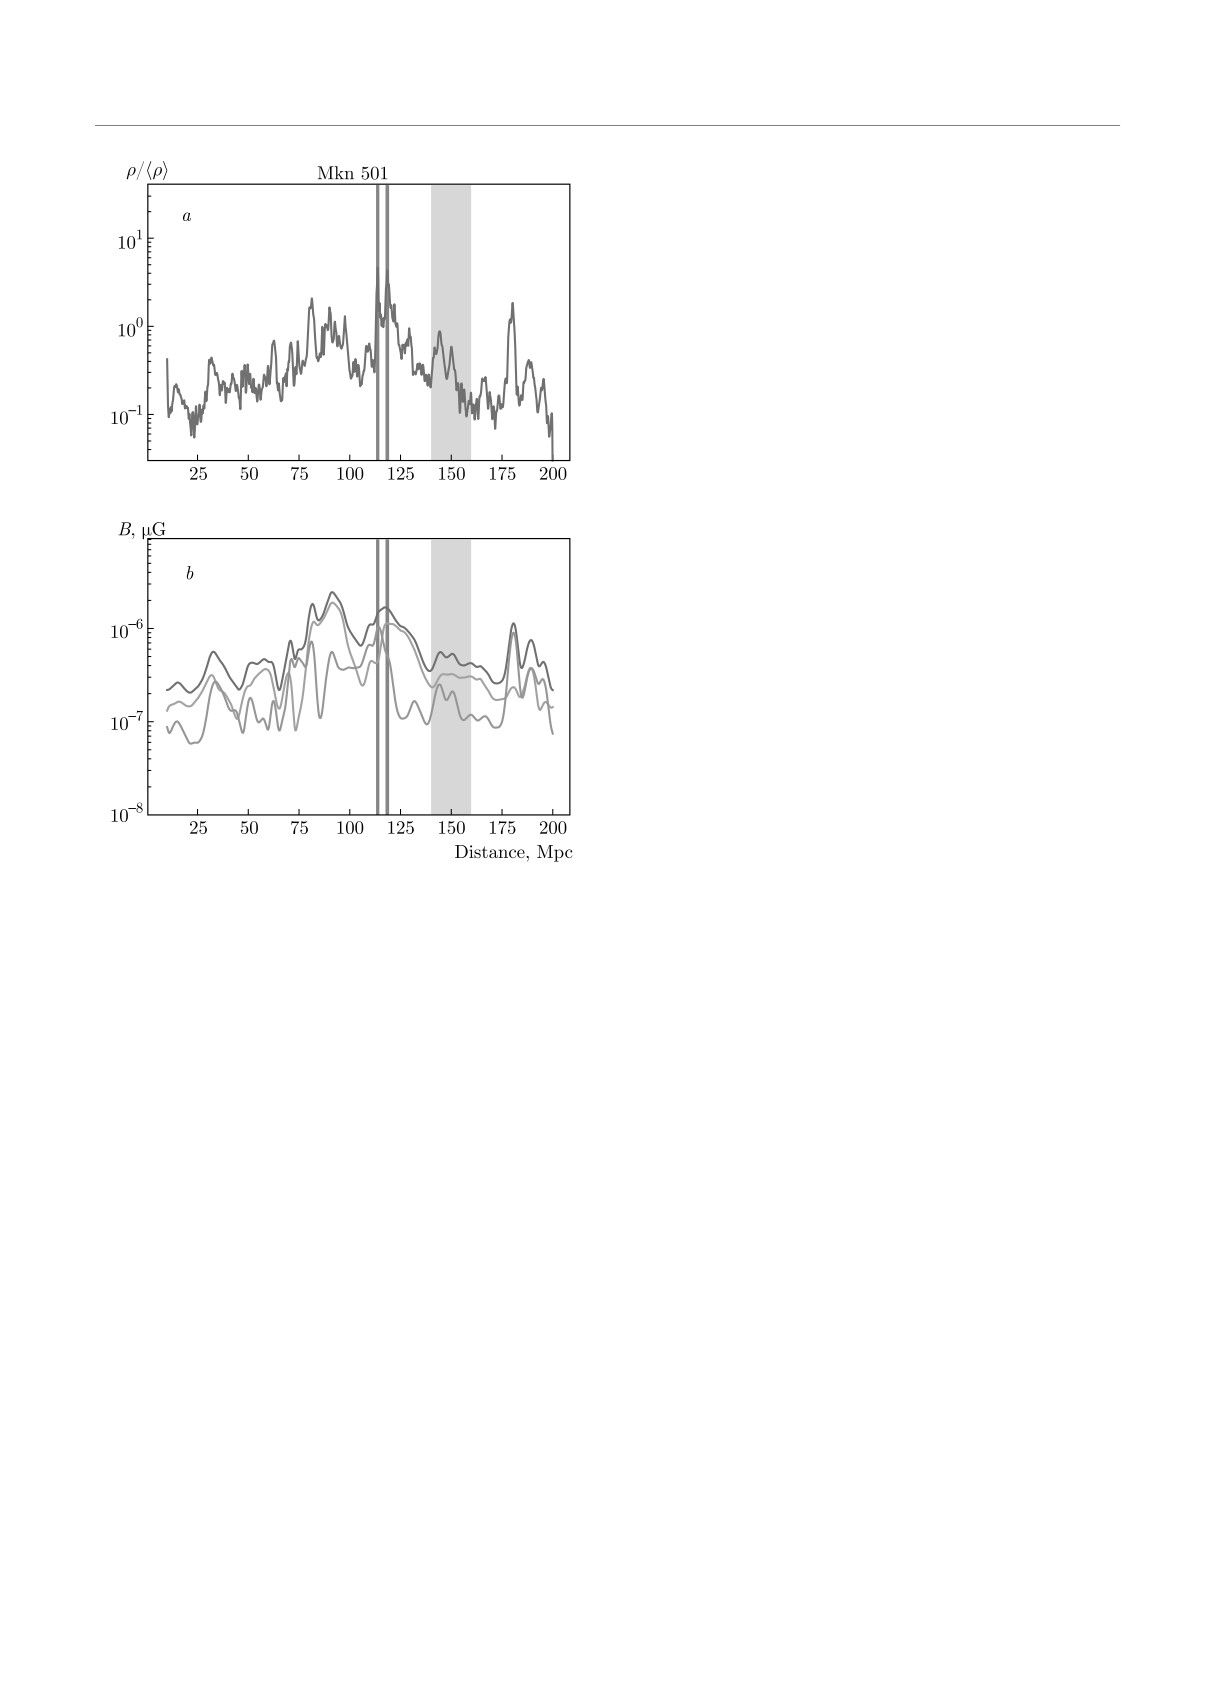
Figure 1 show the line-of-sight profiles of magnetic
tion or feedback as the focus of this study are cosmolo-
field toward Mkn 501. The top panel of the figure
584
ЖЭТФ, том 161, вып. 4, 2022
Detectability of large correlation length inflationary...
We model the secondary cascade γ-ray signal with
the CRbeam Monte Carlo code [25] which propagates
high energy γ-rays through the cosmic medium taking
into account most important physical interactions: pair
production by γ-ray absorption and inverse Compton
scattering of secondary electrons and positrons on the
EBL [35] and CMB. Electrons and positrons are also
deflected in magnetic field whose strength is obtained
from IGMF model described above.
For intrinsic point source spectrum we assume bro-
ken power law spectrum with break position around
100 GeV and maximum energy 100 TeV. All primary
γ-rays have the same direction of initial momenta which
coincides with the direction from the source to the ob-
server. The γ-rays are propagated until they reach the
sphere whose center coincides with the position of the
source and radius is equal to the distance to the ob-
server. To model primary γ-ray emission into a jet with
an opening angle αjet we select γ-rays whose positions
on the sphere lie inside the cone with the opening an-
gle αjet = 5◦ and direction of the axis coincides with
the direction of jet. We do not take into account sec-
ondary photons that were created in the regions with
an overdensity above 3, see Fig. 1. To explore different
strengths of seed magnetic field we rescale the magnetic
field profile by a constant factor keeping the shape of
the profile unchanged.
Jet-like, rather than halo-like extended emission is
Fig. 1. (Color online) Density profile (a), magnetic field (b)
generically expected even for short correlation length
for a line of sight in the direction of Mkn 501. The magnetic
field is split into total (blue), along the line of sight (orange)
IGMF (originating from a cosmological phase transi-
and perpendicular to line of sight (green). The location of the
tion) [36]. Thus, the azimuthal asymmetry of the ex-
source with uncertainty is shown with a grey band. Regions
tended signal is not an indication of the presence of
where the overdensity is greater than 3 are indicated by red
large correlation length IGMF. However, there are two
bands
important differences in the properties of the jet-like
extended emission in the two alternative cases of phase
show the line-of-sight profile of the density field. Re-
transition and inflationary magnetic field. The jet-like
gions with overdensities above 3 that are excluded from
extensions are one-sided in the case of a short corre-
our further analysis because of possible “contamina-
lation length field [36], whereas the jet-like extensions
tion” of the magnetic field by baryonic feedback [22]
are two sided for inflationary field. In addition, in the
are indicated with vertical red bands. In those regions
case of the phase transition IGMF, the position angle of
secondary electrons are randomized by high magnetic
the one-sided jet-like extended emission is determined
fields and their signal in direction to observer can be
by the orientation of the jet of the blazar rather than
safely neglected. Grey bands indicate the distance to
by the direction of the field. It is expected to be ran-
the blazars. The γ-ray source is situated in moder-
dom for different sources, whereas in the case of the
ately overdense regions that are unlikely to be affected
inflationary large correlation length field the extended
by strong magnetised outflows from galaxies. None of
sources associated to different blazars have the same
the three sources have a line-of-sight aligned with a fil-
position angle.
ament of the LSS. This makes Mkn 501 suitable for
If the blazar jet is closely aligned with the line of
the IGMF measurement. Same is true for other two
sight, the two sides of the extended emission are sym-
sources, Mkn 421 and 1ES 1959+650. The bottom
metric, they have comparable surface brightness. This
panel of the figure show the strength of the IGMF along
symmetry can be broken by the misalignment of the
the lines of sight.
jet with the line of sight. The orientation of the two-si-
585
9
ЖЭТФ, вып. 4
A. Korochkin, A. Neronov, G. Lavaux et al.
ЖЭТФ, том 161, вып. 4, 2022
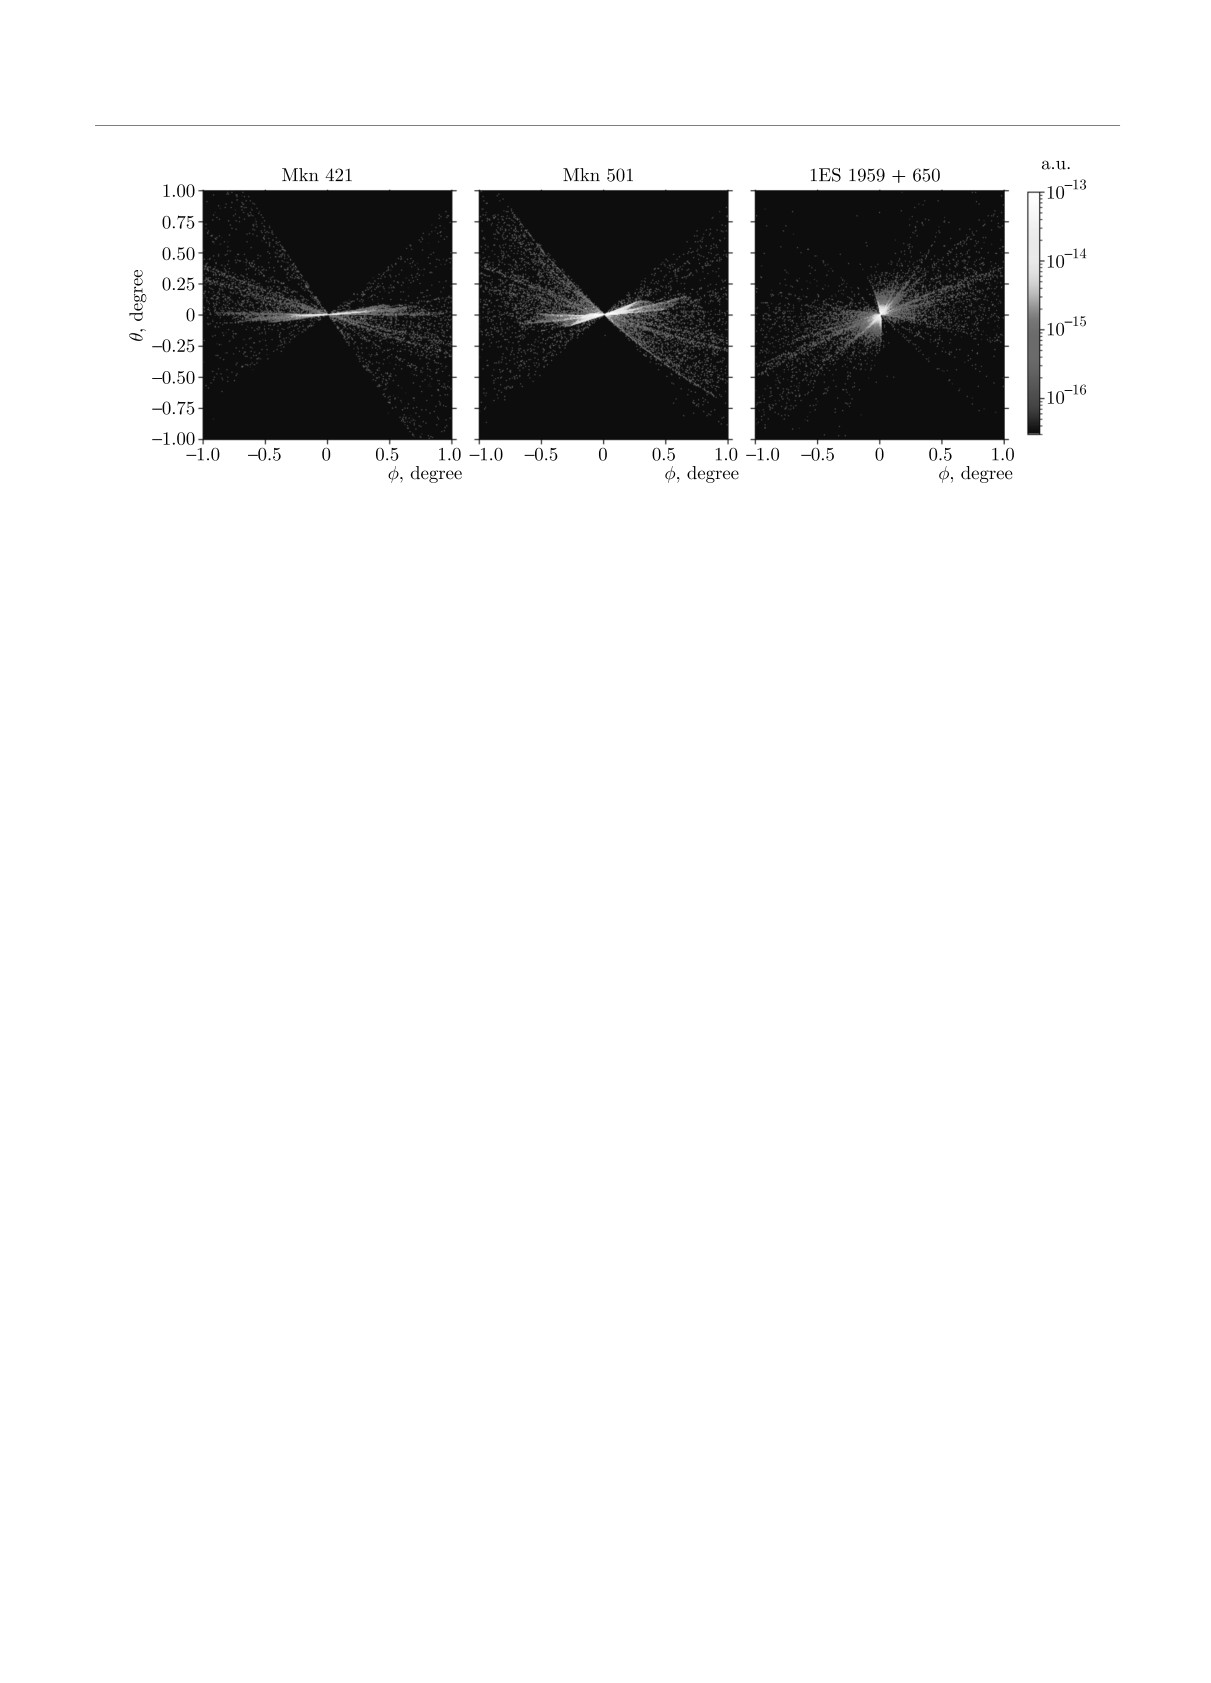
Fig. 2. (Color online) Images of the extended emission signal in the energy range 200 GeV-2 TeV for the three brightest sources
in our sample. The assumed initial cosmological magnetic field strength is B = 10-13 G. The direction of the jet axis coincides
with the direction from the source to the observer and the jet opening angle is 5◦
ded extension that is due to the presence of the large
We extracted the extended source fluxes from
correlation length field is, always perpendicular to the
wedges of the angular width 0.3◦ that contain the sig-
direction of magnetic field projected on the sky. If the
nal. From the wedges, we excluded the regions in which
cosmological IGMF is correlated on the distance scales
the primary source emission dominates, namely, we did
larger than hundreds of Megaparsecs, orientations of
not take into account those regions of the wedges that
the two-sided extensions around different sources all
are located at a distance from the centers less than the
over the sky are all expected to be aligned. Measure-
angular resolution of the CTA. From Fig. 2 one can
ment of aligned extended emission features around mul-
judge that the extended emission is dominated by the
tiple sources can provide an unambiguous evidence for
flux in a much narrower wedge, with opening angle of
the presence of magnetic field of inflationary origin. In
just a few degrees.
this case position angles of the two-sided extensions
This gives a conservative estimate of the detectable
provide the measurement of the direction of the pri-
extended source flux. In principle, stronger signal can
mordial field.
be extracted using the azimuthal asymmetry of the ex-
tended emission. If the shape of the point spread func-
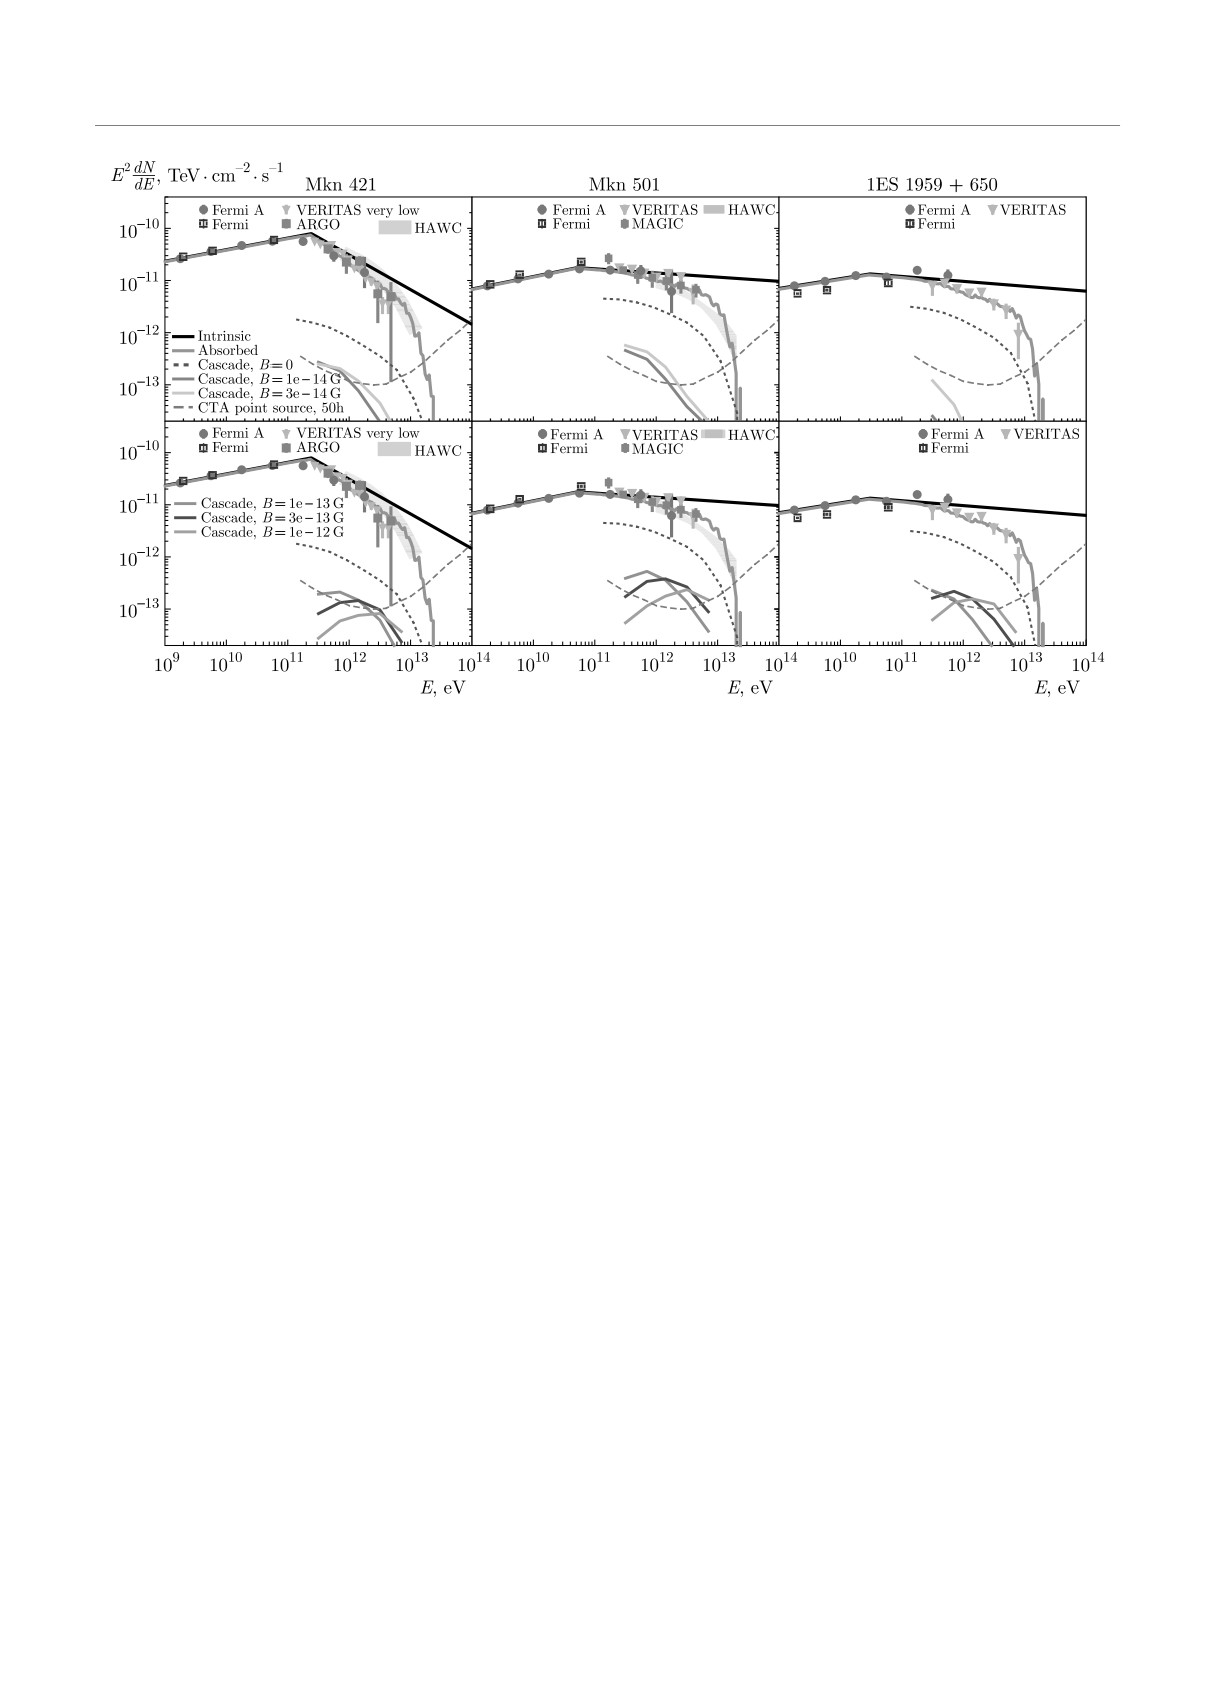
Figure 3 shows spectra of the point and extended
tion is known, the extended emission can be detected
source emission for different assumptions about the
also from within the extent of the point spread function.
magnetic field strength. For each source we choose
Systematic uncertainty of the knowledge of the point
the model of the intrinsic spectrum in such a way that
spread function limits the sensitivity of Cherenkov tele-
it fits the spectral measurements of the “low state” of
scopes for detection of extended emission [43,44]. This
the source and/or the time-averaged spectral measure-
uncertainty can be mitigated by the direct measure-
ments on multi-year time scales. For all sources we
ment of the point spread function in the direction per-
consider two alternative Fermi spectral data: the spec-
pendicular to the direction of extended emission. This
tral measurements reported in the Fermi source cata-
is possible even if the source line of sight is nearly
log [37] and the spectra extracted using the aperture
aligned with the field direction, as illustrated by the
photometry approach for the full 13-year exposure of
example of 1ES 1959+650, shown in the right panel of
Fermi/LAT up to July 2021. This allows us to extend
Fig. 2.
the Fermi catalog measurements up to the 3 TeV ener-
The linear, one-dimensional shape of the extended
gy.
source also provides an improvement of sensitivity for
For Mkn 501 we used MAGIC and VERITAS ana-
another reason. The sensitivity for extended sources
lyses from 2009 [38], and long term observations from
typically worsens with the increase of the solid angle
ARGO [39] and HAWC [40]. For Mkn 421 we used long
spanned by the extended source on the sky, because of
term observations from ARGO [41] and HAWC [40] and
the increase of the background on top of which the sig-
very low state from VERITAS measurement [42].
nal is detected. Concentration of the extended signal
586
ЖЭТФ, том 161, вып. 4, 2022
Detectability of large correlation length inflationary...
Fig. 3. (Color online) Spectra of intrinsic point source and extended emission for different assumed magnetic field strengths upper
panels: 0, 10-14, and 3 · 10-14 G, lower panels: 10-13, 3 · 10-13, and 10-12 G, for the three brightest sources in the sample.
Point source spectra from Fermi LAT, MAGIC [38], VERITAS [38], ARGO [39], and HAWC [40]. Total flux from the cascade
in case B = 0 is shown with dotted line. Extended emission outside of the PSF of point source is shown with colored lines for
magnetic fields between 10-14 G and 10-12 G. Dashed green line show sensitivity of CTA to point sources
in a narrow wedge reduces the solid angle and hence
scopes for detection of extended sources. This compar-
increases the signal-to-noise ratio.
ison shows how challenging the search for the two-sided
jet-like extensions might be. The model predictions for
All the sources in our sample have steep spectra in
the extended signal are at the limit of sensitivity for the
the 10 TeV range. This diminishes the power of the
50 hr exposure of each of the three brightest sources in
secondary emission observable in the 0.1-1 TeV range.
our source sample. However, use of possible improve-
The total flux that would be available for detection (as
ments of the method with “in situ” measurement of the
a contribution to the point source flux) in the absence of
telescope point spread function and careful choice of the
an IGMF is shown by the brown dotted lines in Fig. 3.
wedge for the extended signal measurements may im-
The IGMF deflects electrons and positrons away from
prove the sensitivity. Otherwise, much longer exposure
the line of sight, so that the secondary γ-rays produced
of several hundred hours (instead of 50 hr considered
by the inverse Compton scattering of the Cosmic Mi-
here) can also boost signal-to-noise ratio and make the
crowave Background becomes unobservable. This effect
correlated extended emission signal measureable in all
is stronger at lower energies. This explains the sup-
the three brightest nearby blazars considered above.
pression of the extended flux (that we collect from the
wedge-shaped regions containing the secondary flux)
In this paper we studied a possibility of detec-
at the energies below 100 GeV. If the magnetic field
tion of primordial magnetic field from inflation [12, 19]
is too weak to deflect electrons and positrons, the sec-
with gamma-ray telescopes. Such field can be coher-
ondary flux just contributes to the point source flux
ent on cosmological scales and induce wedge-like ex-
and is also undetectable. This explains the suppression
tended emission around nearby blazars, with aligned
of the secondary signal at higher energies. Both low-
wedge orientations in multiple sources across the sky.
and high-energy suppression depends on the strength
This alignment can be used to distinguish the es-
of magnetic field.
tablish the inflationary origin of IGMF, because it is
Figure 3 shows a comparison of the expected sec-
not expected if the IGMF originates from cosmological
ondary flux levels with the sensitivity of the CTA tele-
phase transitions. For small coherence scale IGMF, the
587
9*
A. Korochkin, A. Neronov, G. Lavaux et al.
ЖЭТФ, том 161, вып. 4, 2022
wedge like appearance of the extended emission is also
9.
R. Banerjee and K. Jedamzik, Phys. Rev. D 70,
generically expected, but the position angles of wedged
123003 (2004), arXiv:astro-ph/0410032.
extended emission around different sources would not
10.
T. Kahniashvili, A. G. Tevzadze, A. Brandenburg,
be correlated, because it is determined by the orienta-
and A. Neronov, Phys. Rev. D 87, 083007 (2013),
tion of the jets in the primary blazar source.
arXiv:1212.0596 [astro-ph.CO].
The morphology of the secondary emission depends
on the jet orientation also for the inflationary magnetic
11.
M. S. Turner and L. M. Widrow, Phys. Rev. D 37,
field. However, the jet orientation does not affect the
2743 (1988).
position angle of the extended source.
12.
B. Ratra, Astrophys. J. Lett. 391, L1 (1992).
Acknowledgements. This work has made use of
13.
W. D. Garretson, G. B. Field, and S. M. Car-
the Infinity Cluster hosted by Institut d’Astrophysique
roll, Phys. Rev. D 46, 5346 (1992), arXiv:hep-ph/
de Paris. We thank Stéphane Rouberol for running
9209238.
this cluster smoothly for us. This work has been done
14.
A. D. Dolgov, Phys. Rev. D 48, 2499 (1993).
consortium.org).
15.
M. Gasperini, M. Giovannini, and G. Veneziano,
Funding. The work of A. N., G. L., M. R., and
Phys. Rev. Lett. 75,
3796
(1995), arXiv:hep-th/
D. S. has been supported in part by the French National
9504083.
Research Agency (ANR) grant ANR-19-CE31-0020,
16.
M. Giovannini and M. E. Shaposhnikov, Phys. Rev.
work of A. K. was supported in part by Russian Sci-
D 62, 103512 (2000), arXiv:hep-ph/0004269.
ence Foundation grant 20-42-09010. A. K.’s stay in
the APC laboratory was provided by the “Vernadsky”
17.
V. Demozzi, V. Mukhanov, and H. Rubinstein, JCAP
scholarship of the French embassy in Russia.
08, 025 (2009), arXiv:0907.1030 [astro-ph.CO].
18.
R. J. Z. Ferreira, R. K. Jain, and M. S. Sloth, JCAP
10, 004 (2013), arXiv:1305.7151 [astro-ph.CO].
The full text of this paper is published in the English
version of JETP.
19.
R. Durrer and A. Neronov, Astron. Astrophys. Rev.
21, 62 (2013), arXiv:1303.7121 [astro-ph.CO].
REFERENCES
20.
S. Bertone, C. Vogt, and T. Enßlin, MNRAS 370,
319 (2006), arXiv:astro-ph/0604462 [astro-ph].
1. R. Plaga, Nature (London) 374, 430 (1995).
21.
F. Marinacci, M. Vogelsberger, R. Pakmor, P. Torrey,
2. A. Neronov and D. V. Semikoz, JETP Lett. 85, 473
V. Springel, L. Hernquist, D. Nelson, R. Weinberger,
(2007), arXiv:astro-ph/0604607.
A. Pillepich, J. Naiman, and S. Genel, MNRAS 480,
5113 (2018), arXiv:1707.03396 [astro-ph.CO].
3. A. Neronov and D. V. Semikoz, Phys. Rev. D 80,
123012 (2009), arXiv:0910.1920 [astro-ph.CO].
22.
K. Bondarenko, A. Boyarsky, A. Korochkin, A. Ne-
ronov, D. Semikoz, and A. Sokolenko, arXiv:2106.
4. A. Neronov and I. Vovk, Science 328, 73 (2010),
02690 [astro-ph.CO].
arXiv:1006.3504 [astro-ph.HE].
5. A. Taylor, I. Vovk, and A. Neronov, Astron.
23.
J. Jasche and B. D. Wandelt, MNRAS 432, 894
Astrophys.
529, A144
(2011), arXiv:1101.0932
(2013), arXiv:1203.3639 [astro-ph.CO].
[astro-ph.HE].
24.
R. Teyssier, Astron. Astrophys. 385, 337 (2002),
6. M. Ackermann et al. (Fermi-LAT), Astrophys.
arXiv:astro-ph/0111367 [astro-ph].
J. Suppl.
237,
32
(2018), arXiv:1804.08035
25.
V. Berezinsky and O. Kalashev, Phys. Rev. D 94,
[astro-ph.HE].
023007 (2016), arXiv:1603.03989 [astro-ph.HE].
7. A. Korochkin, O. Kalashev, A. Neronov, and D. Se-
mikoz, Astrophys. J. 906, 116 (2021), arXiv:2007.
26.
S. Fromang, P. Hennebelle, and R. Teyssier,
14331[astro-ph.CO].
SF2A-2005: Semaine de l’Astrophysique Francaise,
743 (2005).
8. I. Vovk, J. Biteau, H. Martínez-Huerta, M. Meyer,
and S. Pita (CTA Consortium), PoS ICRC2021, 894
27.
J. Jasche and G. Lavaux, Astron. Astrophys. 625,
(2021), arXiv:2110.07864 [astro-ph.IM].
A64 (2019), arXiv:1806.11117 [astro-ph.CO].
588
ЖЭТФ, том 161, вып. 4, 2022
Detectability of large correlation length inflationary...
28. G. Lavaux and M. J. Hudson, MNRAS 416, 2840
37. S. Abdollahi et al. (Fermi-LAT), Astrophys. J. Suppl.
(2011), arXiv:1105.6107 [astro-ph.CO].
247, 33 (2020), arXiv:1902.10045[astro-ph.HE].
29. O. Hahn and T. Abel, MNRAS 415, 2101 (2011),
38. A. A. Abdo et al. (LAT, MAGIC, VERITAS),
arXiv:1103.6031 [astro-ph.CO].
Astrophys. J.
727,
129
(2011), arXiv:1011.5260
[astro-ph.HE].
30. T. Miyoshi and K. Kusano, J. Computational Phys.
208, 315 (2005).
39. B. Bartoli et al., Astrophys. J. 758, 2 (2012), arXiv:
31. K. Bondarenko, J. Pradler, and A. Sokolenko,
1209.0534 [astro-ph.HE].
Phys. Lett. B 805, 135420 (2020), arXiv:2002.08942
40. S. Coutiño de Leon, A. C. Alonso, D. Rosa-Gonzalez,
[astro-ph.CO].
and A. L. Longinotti, in 36th International Cosmic
32. C. R. Evans and J. F. Hawley, Astrophys. J. 332, 659
Ray Conference (ICRC2019) (2019), Vol. 36, p. 654,
(1988).
arXiv:1909.01179[astro-ph.HE].
33. F. A. Stasyszyn and D. Elstner, J. Computa-
41. B. Bartoli et al. (ARGO-YBJ), Astrophys. J. Suppl.
tional Phys.
282,
148
(2015), arXiv:1411.3290
222, 6 (2016), arXiv:1511.06851 [astro-ph.HE].
[astro-ph.IM].
42. V. A. Acciari et al., Astrophys. J. 738, 25 (2011),
34. P. Mocz, R. Pakmor, V. Springel, M. Vogelsberger,
arXiv:1106.1210 [astro-ph.HE].
F. Marinacci, and L. Hernquist, MNRAS 463, 477
(2016), arXiv:1606.02310 [astro-ph.IM].
43. A. Neronov, D. V. Semikoz, P. G. Tinyakov, and
I. I. Tkachev, Astron. Astrophys. 526, A90 (2011),
35. A. Franceschini, G. Rodighiero, and M. Vaccari, Ast-
ron. Astrophys. 487, 837 (2008), arXiv:0805.1841.
arXiv:1006.0164 [astro-ph.HE].
36. A. Neronov, D. Semikoz, M. Kachelriess, S. Ostap-
44. P. Da Vela, A. Stamerra, A. Neronov, E. Prandini,
chenko, and A. Elyiv, Astrophys. J. Lett. 719, L130
Y. Konno, and J. Sitarek, Astropart. Phys. 98, 1
(2010), arXiv:1002.4981 [astro-ph.HE].
(2018).
589